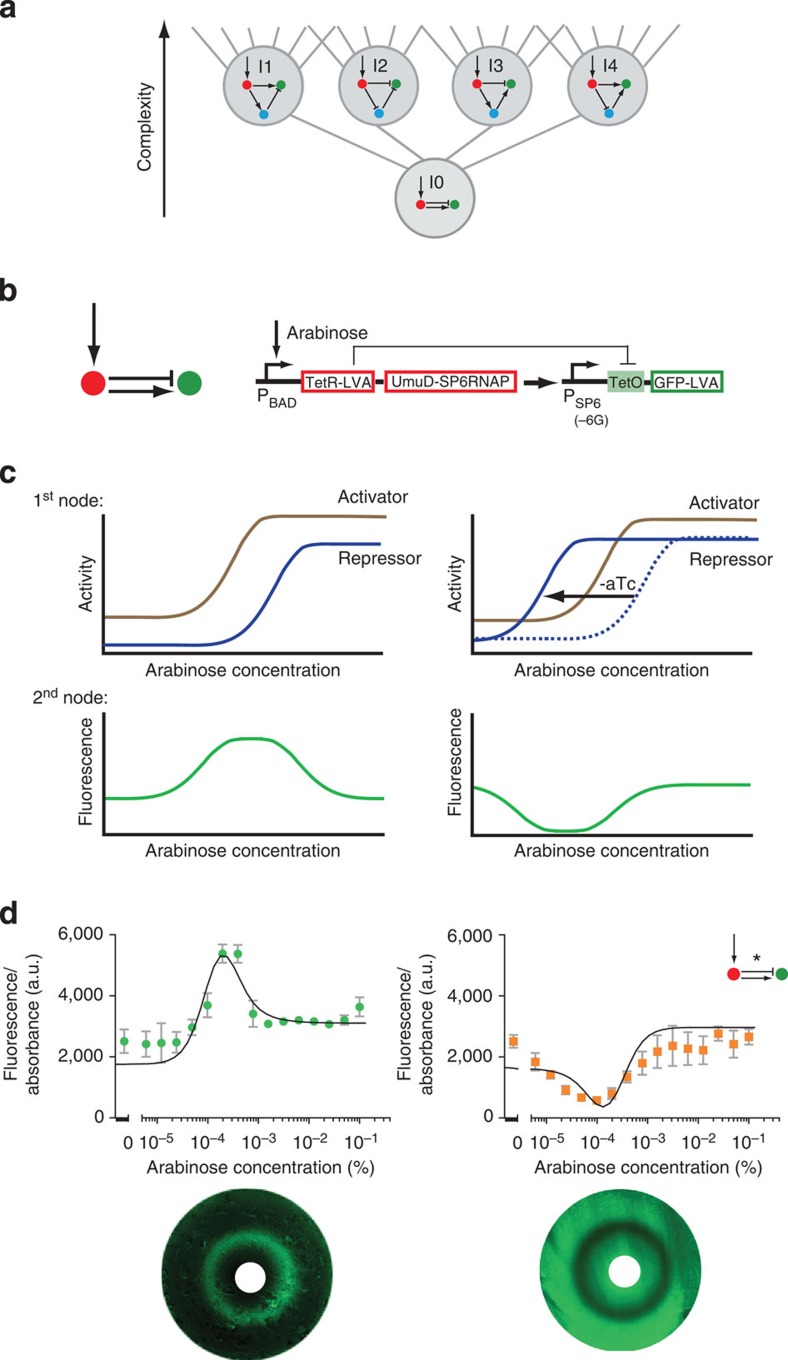
Figure 6. Two-node archetypal stripe-forming network (I0).
(a) I0 network complexity shown relative to the I-FFL stripe-forming family. (b) Circuit implementation in the network scaffold. (c) Schematic depictions of archetypal stripe (left) and anti-stripe (right) mechanisms. (d) E. coli transformed with the I0 network display a fluorescent stripe (left) or anti-stripe (right) in arabinose gradients, depending on the aTc concentration (0.125 μM for stripe, 0 μM for antistripe). Mean and s.d. from three biological replicates. The black lines represent the model fitted simultaneously to the RNA data and fluorescence output of the stripe, anti-stripe and a further variant at 5 h of growth (Supplementary Fig. 10). Corresponding bacterial lawns display a fluorescent ring or anti-ring as a function of arabinose gradients from central paper disks (white)28,31 (bottom).

