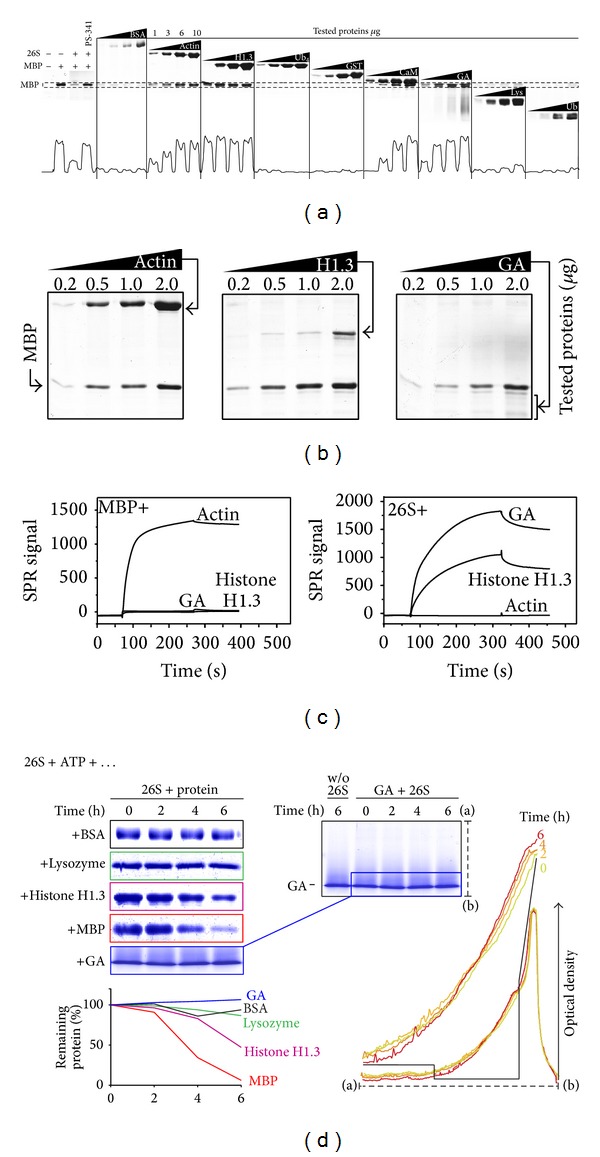
Figure 2.

(a and b) Degradation of bovine MBP by 26S proteasome in the presence of tested proteins (1–10 μg) as indicated. The bottom curve on panel (a) represents the densitometry analysis of the remaining MBP (dashed area on top). (c) Sensorgrams from SPR measurements for the interaction between GA, histone H1.3, CaM, and immobilized MBP (left panel); 26S proteasome and immobilized actin, GA, and histone H1.3 (right panel). (d) Degradation of BSA, lysozyme, histone H1, GA, and MBP by 26S proteasome in presence of ATP as monitored by PAGE. The percentage of protein remaining was calculated as the ratio of protein at the indicated time-points relative to the initial protein. The insertion shows the overlaid densitometry profiles of GA samples incubated with the 26S proteasome.
