
Figure 1.
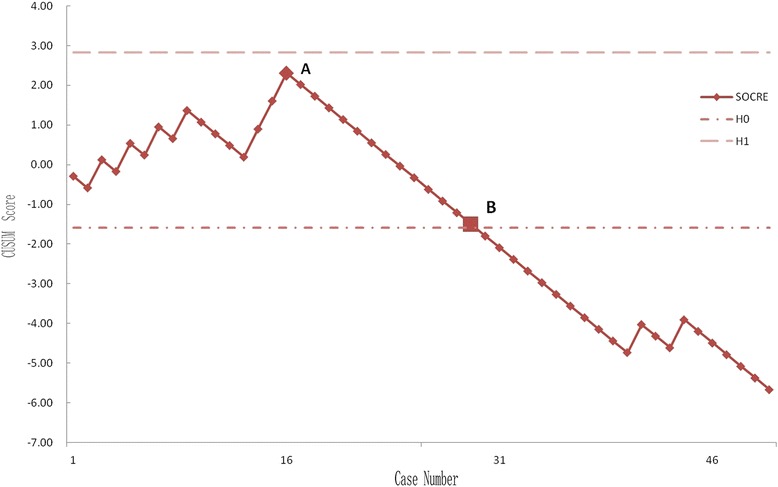
CUSUM learning curve. Point A (case 16) corresponds to the main inflection point at which the failure rate begins to keep consistent. At point B (case 29), the line crosses the lower decision limit and the failure rate is equal to the defined acceptable failure rate (20%). The failure rate did not reach the unacceptable threshold (h1) at any time.