. 2014 Sep 10;12:242. doi: 10.1186/s12967-014-0242-x
© Sheng et al.; licensee BioMed Central Ltd. 2014
This is an Open Access article distributed under the terms of the Creative Commons Attribution License (http://creativecommons.org/licenses/by/4.0), which permits unrestricted use, distribution, and reproduction in any medium, provided the original work is properly credited. The Creative Commons Public Domain Dedication waiver (http://creativecommons.org/publicdomain/zero/1.0/) applies to the data made available in this article, unless otherwise stated.
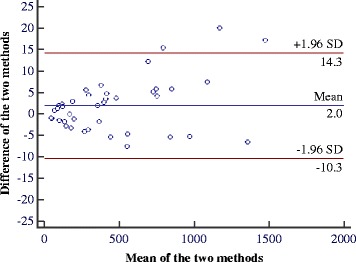
Figure 8.

Bland-Altman diagram for data summarized in Table 2 .
