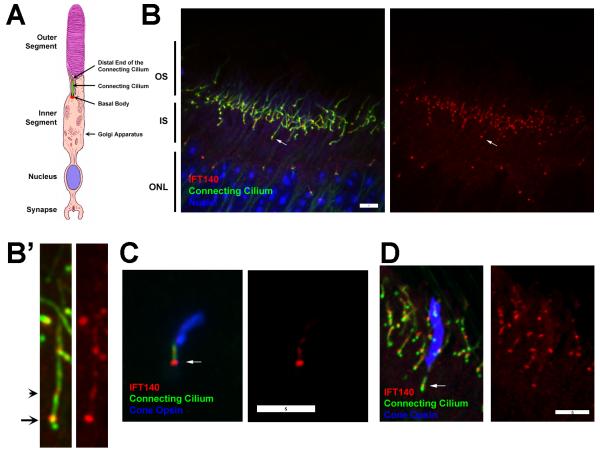
Figure 1. IFT140 in photoreceptors.
A. Diagram of a photoreceptor rod cell. Image is modified from [Williams, 2008].
B. Paraffin section from a wild type P28 animal stained for IFT140 (red), cilia (6-11B-1, anti-acetylated tubulin, green) and DAPI (blue). The retina is oriented similar to the drawing in A. Arrow points at the basal body end of a connecting cilium. Images are maximum projections of 17 image Z-stacks taken at 0.25 μm intervals. Scale bar is 5 μm. B’. 4X enlargements of the cell marked with an arrow in B. Arrow points at the basal body end of the cilium, arrow head points at the presumed distal end of the connecting cilium.
C. Dispersed cone cell from a wild type P28 animal stained for IFT140 (red), cilia (6-11B-1, green) and RG-opsin (blue). Scale bar is 5 μm. Arrow marks the basal body.
D. Paraffin section of a wild type animal stained for IFT140 (red), cilia (6-11B-1, green) and RG-opsin (blue). Scale bar is 5 μm. Arrow marks the basal body region of the cone cell.

