
Fig. 3.
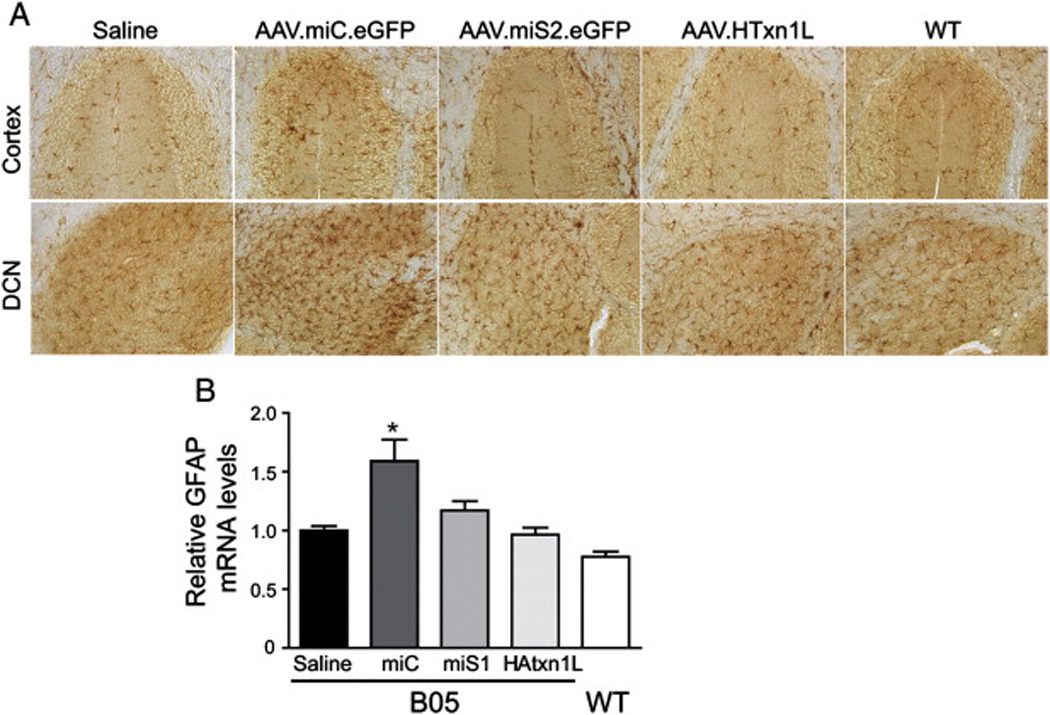
AAV.miS1.eGFP and AAV.HAtxn1L treated animals show no adverse microglia or astroglia activation in the cerebellum. A) Sagittal 60 µm-thick representative cerebellar sections from all groups were stained for the microglia activation marker Iba1. Top panels show Iba1 levels in comparable sections of cerebellar cortex. Bottom panels show Iba1 levels at the injection site in the DCN. No gross difference in the amount of microglia activation was seen between wild type animals and individual treatment groups (n = 3 mice per treatment group; 1–3 sections per mouse were evaluated). B) Quantitative PCR was used to quantify relative GFAP expression levels, an astroglia marker. No significant differences were seen between therapeutic treatment groups and saline treated animals. However, AAV.miC.eGFP injected B05 animals had higher levels of GFAP than all other groups. Results are shown as mean ± SEM (n = 4 mice per treatment group; samples assayed in triplicate, * indicates p < 0.05).