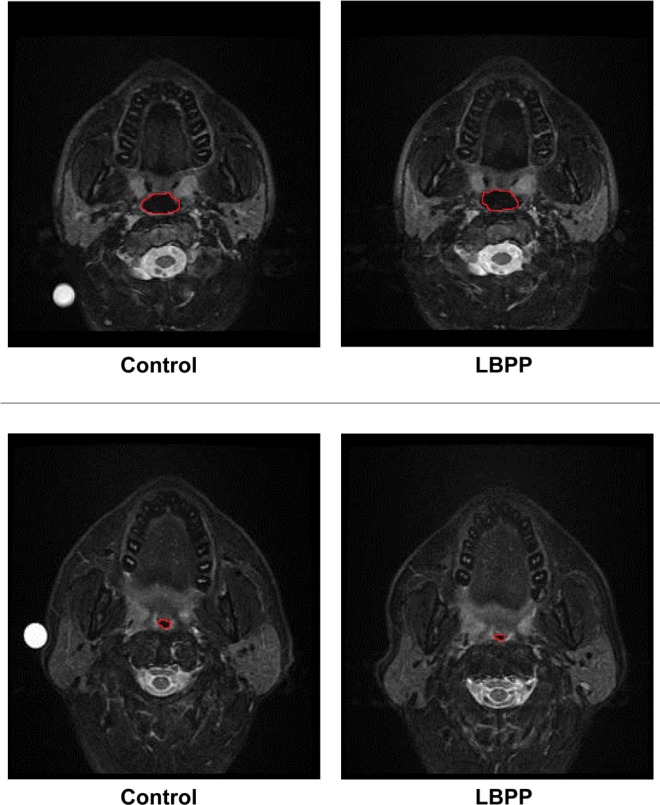
Figure 1. Magnetic resonance images of the upper airway (UA) of subjects.

top: In the NSA subject, LBPP caused UA-XSA to increase compared to control (from 3.01 to 3.71 cm2). bottom: In the OSA subject, LBPP caused UA-XSA to decrease compared to control (from 2.04 to 1.72 cm2). LBPP, lower body positive pressure; NSA, no sleep apnea; OSA, obstructive sleep apnea; UA, upper airway; UA-XSA, upper airway cross-sectional area.
