
Figure 2. Comparisons of mean UA-XSA during control and LBPP in the NSA and OSA groups.
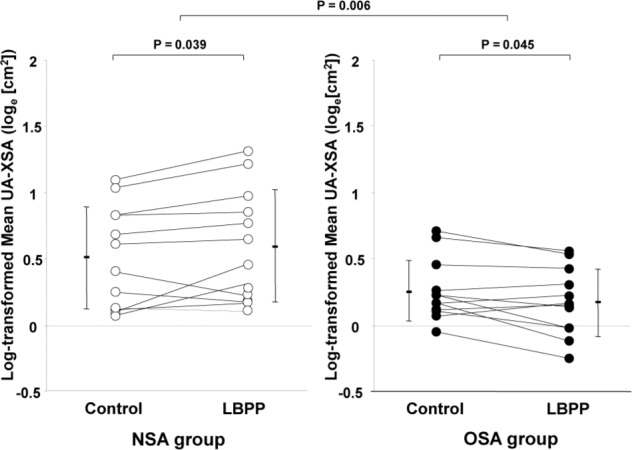
In the NSA group, mean UA-XSA during LBPP increased significantly compared to control (log-transformed UA-XSA, 0.60 ± 0.42 versus 0.51 ± 0.38, respectively [median (interquartile range); absolute UA-XSA, 1.67 (1.17) versus 1.74 (1.36) cm2, respectively], whereas in the OSA group mean UA-XSA decreased significantly during LBPP compared to control (log transformed UA-XSA, 0.18 ± 0.25 versus 0.26 ± 0.23, respectively) [median (interquartile range); absolute UA-XSA, 1.17 (0.52) versus 1.23 (0.40) cm2, respectively]. The change in mean UA-XSA in response to LBPP differed significantly between the 2 groups (p = 0.006). Note that data are plotted on a log scale. LBPP, lower body positive pressure; NSA, no sleep apnea; OSA, obstructive sleep apnea; UA-XSA, upper airway cross-sectional area.