
Figure 3.
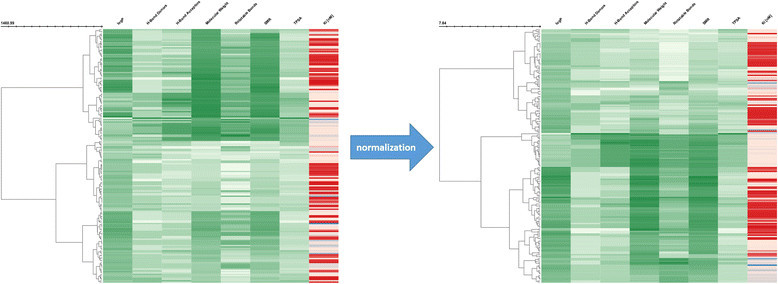
The comparison of ERα ligand clusterings performed with original (left panel) and normalized (right panel) values. The data were clustered by Ward’s clustering with the Euclidean distance. In the case of the clustering of normalized data (right panel), original data values are depicted in the heatmap (parameter --write_original of inchlib_clust).