
Figure 1.
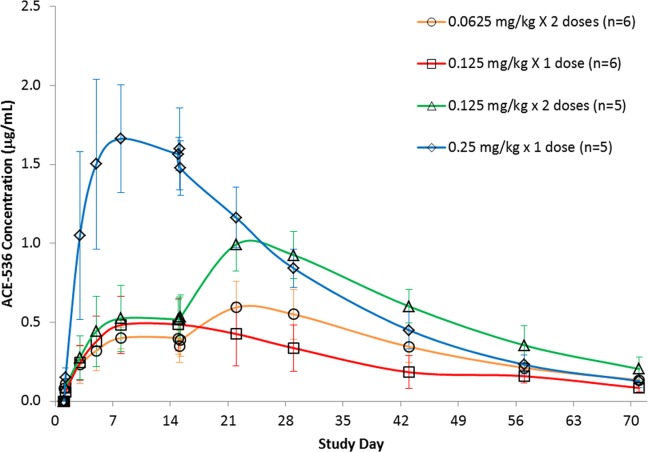
Pharmacokinetic profile of ACE-536 concentrations following one or two subcutaneous doses in healthy postmenopausal women treated with ACE-536 (mean ± SD).
Official websites use .gov
A
.gov website belongs to an official
government organization in the United States.
Secure .gov websites use HTTPS
A lock (
) or https:// means you've safely
connected to the .gov website. Share sensitive
information only on official, secure websites.
Pharmacokinetic profile of ACE-536 concentrations following one or two subcutaneous doses in healthy postmenopausal women treated with ACE-536 (mean ± SD).