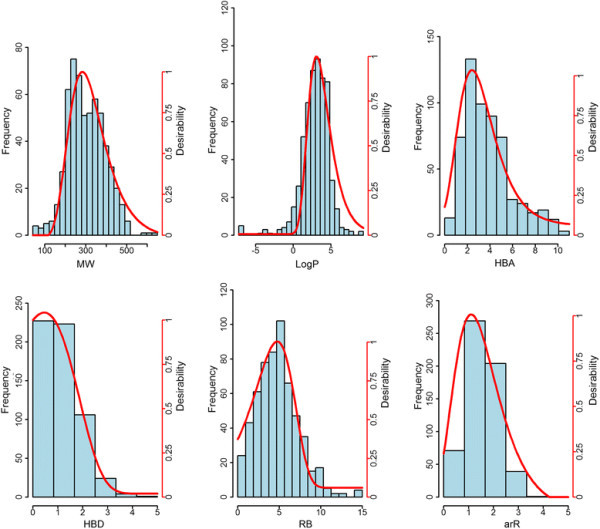
Figure 2.

Frequency counts and desirability function plots of insecticides. Histograms and desirability functions (red curve, see right scale) of six molecular descriptors, i.e., MW (molecular weight), LogP (log of the octanol–water partition coefficient), HBA (number hydrogen bond acceptors), HBD (number hydrogen bond donors), RB (number of rotatable bonds), arR (number of aromatic rings), computed for the insecticides subset.
