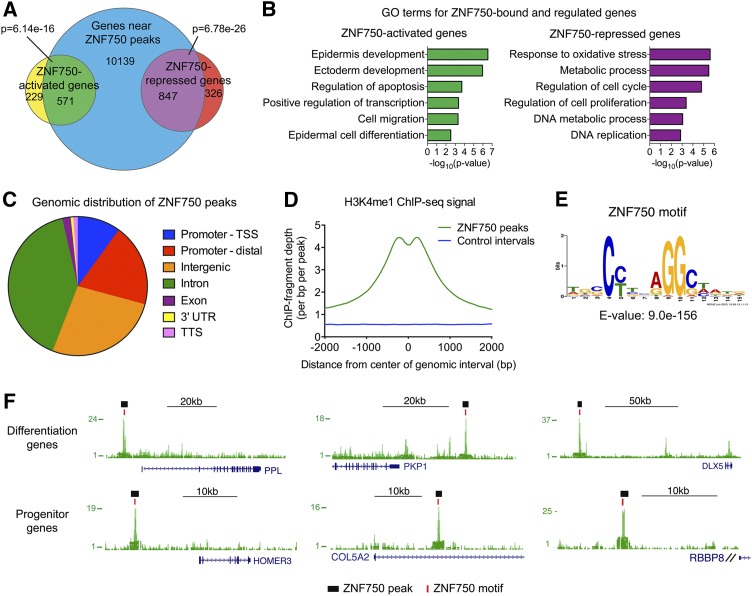
Figure 1.
ZNF750 genomic binding. (A) Overlap of genes associated with ZNF750 ChIP-seq peaks by GREAT with ZNF750-activated and ZNF750-repressed genes. P-values determined by Fisher’s exact test. (B) Gene ontology (GO) terms for putative direct ZNF750-activated or ZNF750-repressed genes. (C) Distribution of ZNF750 peaks across the genome. (TSS) Transcription start site; (TTS) transcription termination site; (Promoter-TSS) +1 to −5 kb of TSS and 5′ untranslated region (UTR); (Promoter-distal) −5 to −100 kb of TSS. (D) Histogram of keratinocyte H3K4me1 ChIP-seq fragment depth (The ENCODE Project Consortium 2012) in ZNF750 peaks compared with size-matched control genomic intervals. (E) ZNF750 sequence-specific DNA motif identified in ChIP-seq peaks. (F) Representative ZNF750 ChIP-seq peaks near differentiation or progenitor genes. Black bars denote MACS-called peaks, and red bars denote ZNF750 motifs. See also Supplemental Figure S1 and Supplemental Table S1.

