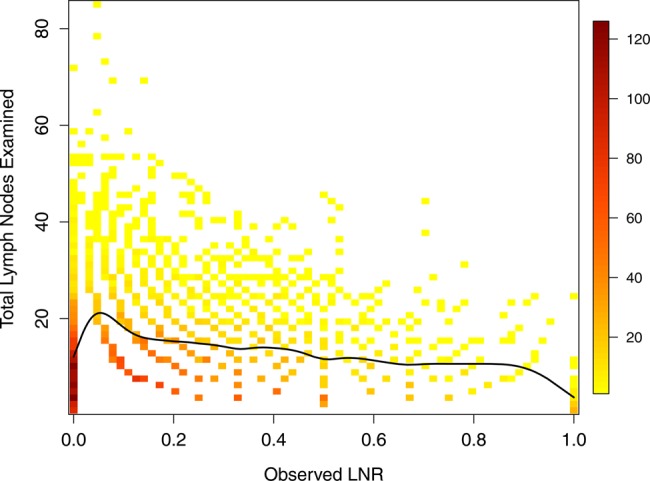
Figure 1.

Scatter plot of total lymph nodes examined (TLN) versus observed lymph node ratio (LNR). The colors and legend represent the number of subjects at each point, and the solid line a smoothing spline fit to the TLN and LNR data points. 6174 SEER subjects in the analysis dataset had at least one examined node and are included in the plot.
