Figure 1.
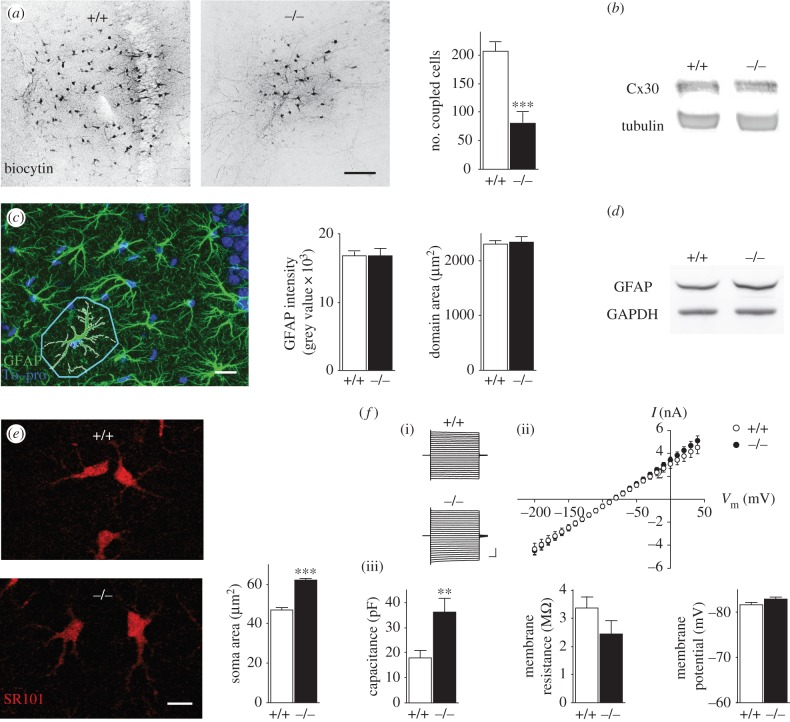
Role of Cx43 in morphological and electrophysiological properties of hippocampal astrocytes. (a) Sample images and quantification of GJ-mediated biocytin coupling in CA1 stratum radiatum astrocytes from wild-type (+/+, n = 5) and Cx43−/− (−/−, n = 5) hippocampal slices. Scale bar, 100 µm. (b) Representative Cx30 immunoblot analysis in hippocampal extracts from juvenile +/+ (n = 3) and −/− (n = 3) mice. Equivalent loading was assessed by tubulin levels. (c) Sample image of hippocampal immunostaining with the astrocytic marker GFAP and the nucleus marker To-pro, illustrating the astroglial domain area (delineated in light blue). Quantification of GFAP staining and astroglial domain area in +/+ (n = 15 and n = 88, respectively) and −/− (n = 20 and n = 99, respectively) mice. Scale bar, 20 µm. (d) Representative GFAP immunoblot analysis in hippocampal extracts from +/+ (n = 3) and −/− (n = 3) mice. Equivalent loading was assessed by GAPDH levels. (e) Sample images of sulforhodamine 101 (SR101) labelling of astrocytes and quantification of their soma size in +/+ (n = 186) and −/− (n = 181) mice. Scale bar, 10 µm. (f)(i) Representative astroglial whole-cell current profiles evoked by 150 ms voltage steps (−200 to +40 mV; scale bar, 2 pA, 20 ms) and (ii) quantification of current–voltage (I/V) plots and (iii) intrinsic membrane properties of +/+ (n = 7 and 10, respectively) and −/− (n = 8 and 11, respectively) astrocytes. Asterisks indicate statistical significance (Student's unpaired t-test or two-way repeated measures ANOVA (f), ***p < 0.001, **p < 0.01).

