Figure 3.
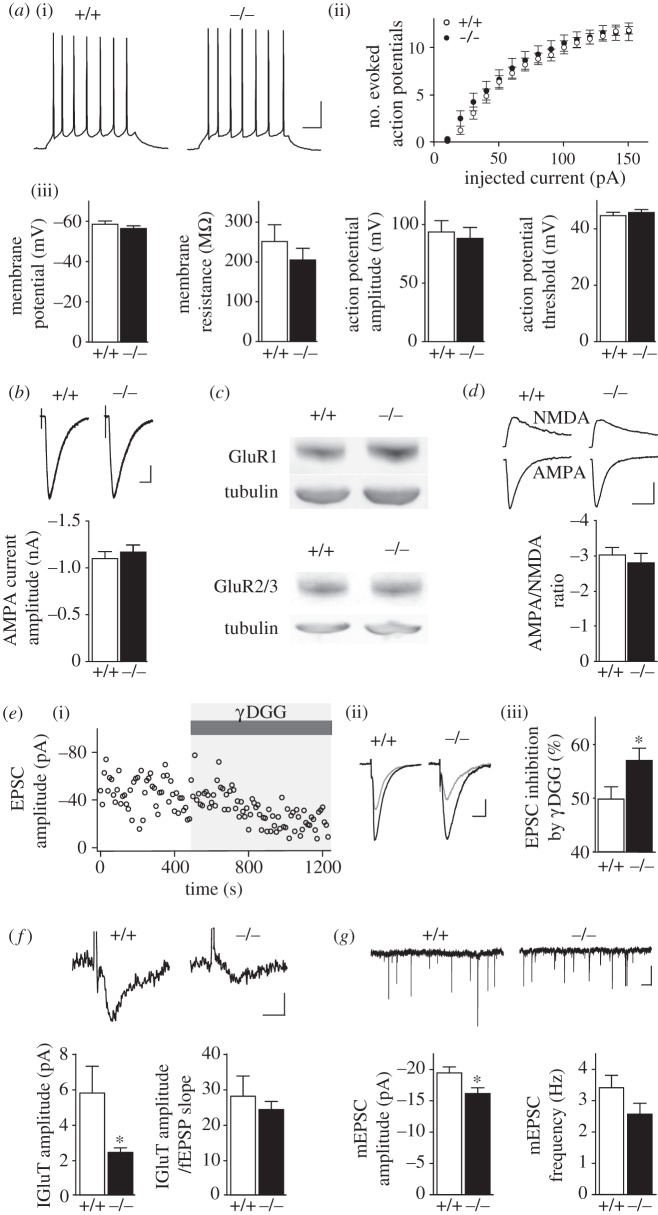
Cx43 sets synaptic glutamate levels. (a)(i) Representative sample traces of action potentials elicited by current injections (40 pA, 500 ms) in CA1 pyramidal neurons from wild-type (+/+) and Cx43−/− (−/−) slices. Scale bar, 20 mV, 50 ms. Quantification of CA1 pyramidal cells (ii) excitability and (iii) intrinsic membrane properties in +/+ (n = 10) and −/− (n = 11) mice. (b) Whole-cell currents evoked by local AMPA application (5 s, 10 μM S-AMPA + 0.5 μM tetrodotoxin + 100 μM cyclothiazide) in CA1 pyramidal cells from +/+ (n = 13) and −/− (n = 12) mice. Scale bar, 200 pA and 10 s. (c) Sample GluR1 and GluR2/3 immunoblot analysis in hippocampal extracts from +/+ (n = 3) and −/− (n = 3) mice. Equivalent loading was assessed by tubulin levels. (d) Ratios of AMPA to NMDA EPSCs in CA1 pyramidal cells from +/+ (n = 11) and −/− mice (n = 8). Scale bars, 20 pA and 40 ms. (e)(i) EPSC amplitude inhibition over time by γ-DGG (0.5 mM, grey) in a representative cell reveals endogenous synaptic glutamate levels. (ii) Sample EPSCs before (black) and after γ-DGG (grey) application, and (iii) quantification of γ-DGG EPSC mean inhibition in +/+ (n = 13) and −/− (n = 13) mice. Scale bar, 10 pA and 20 ms. (f) Synaptically evoked astrocytic GLT currents in +/+ (n = 5) and −/− (n = 5) mice. Sample traces and quantification of GLT current amplitudes and normalization to the simultaneously recorded excitatory synaptic transmission (fEPSP slope) are shown. Scale bar, 3 pA, 10 ms. (g) mEPSCs amplitude and frequency in CA1 pyramidal cells, with sample traces above, from +/+ (n = 9) and −/− (n = 10) mice. Scale bar, 10 pA, 1 s. Asterisks indicate statistical significance (two-way repeated measures ANOVA (a)(ii) and Student's unpaired t-test, *p < 0.05).

