Figure 1.
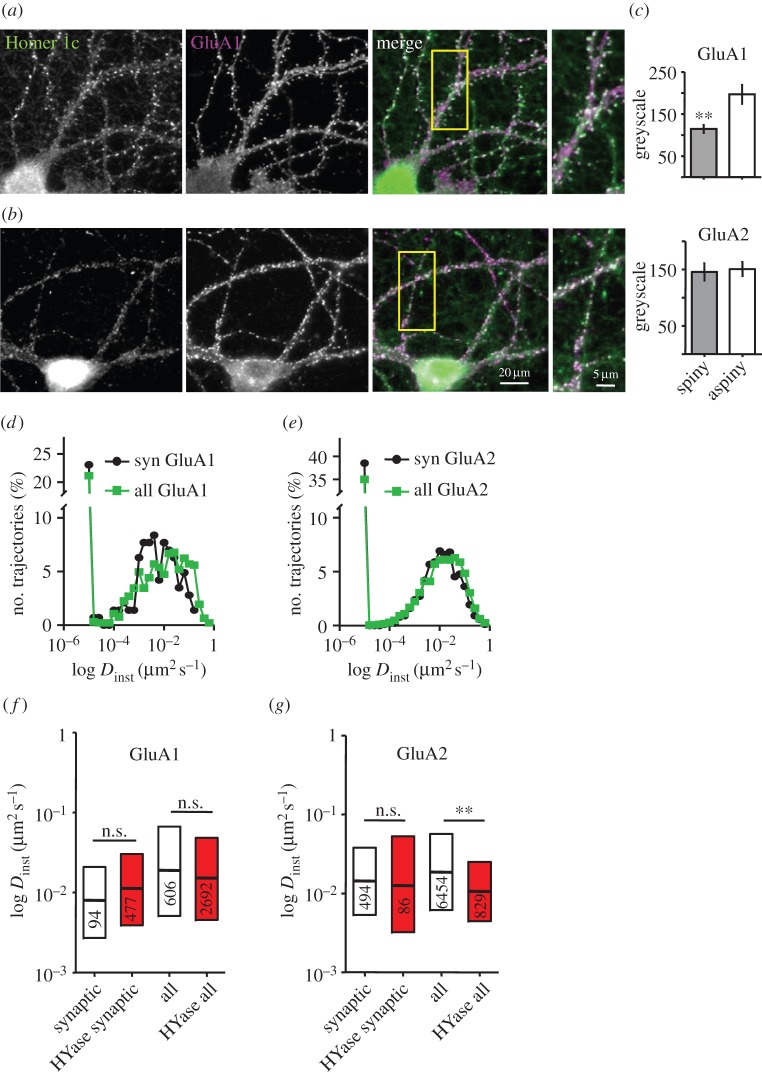
The lateral mobility of GluA1 and GluA2 around aspiny synapses. (a,b) Dual labelling of Homer 1c (green) and GluA1 (magenta) in a spiny (a) and an aspiny (b) neuron. Boxed regions are magnified on the right. Scale bars apply to (a) and (b). (c) Quantification of synaptic live-staining for GluA1 (upper panel) and GluA2 (lower panel) AMPAR subunits in spiny and aspiny neurons. Data are shown as mean ± s.e.m., p < 0.01, t-test. (d,e) Distribution of instantaneous diffusion coefficients (Dinst) for synaptic (syn) and all trajectories (all) of endogenous GluA1 (d) and GluA2 (e) subunits in aspiny neurons obtained in SPT experiments ((d) synaptic: n = 143, all: n = 928 trajectories, eight cells, (e) synaptic: n = 882, all: n = 10 937 trajectories, two cells). (f,g) Box-plots show Dinst for the mobile fraction (D > 0.001 µm² s−1) of GluA1 (f) and GluA2 (g) in aspiny neurons under control conditions and after exposure to hyaluronidase (HYase). Data are shown as median/interquartile range, p < 0.005; Mann–Whitney test.

