
Figure 1.
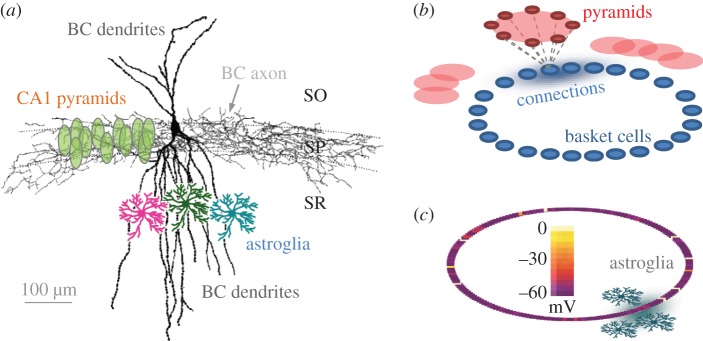
Simulated network of basket cells–pyramidal cells. (a) A diagram illustrating characteristic morphology of a reconstructed basket cell (BC, modified from [37]), the extent of its dendritic and axonal trees in hippocampal area CA1, and relative arrangements of pyramidal cell bodies and astrocytes (showing several examples only), as indicated. SO, SP, SR: strata oriens, pyramidale, radiatum, respectively. (b) A schematic illustrating the architecture of the simulated BC network (not to scale), with each BC (blue) receiving excitatory synaptic input from a pyramidal cell subnetwork (red); blue shadow (connections) qualitatively depicts the Gaussian distribution of cell–cell connection weights centred at a given BC. (c) A simulation snapshot of membrane voltage for the 200-cell BC network (as depicted in b); scale bar, voltages in pseudo-colours. Grey shadow illustrates the spread of a volume-limited (astroglia-like) effect on synaptic transmission mimicking the local action of astrocytes. See §2 Material and methods and figures for further detail.