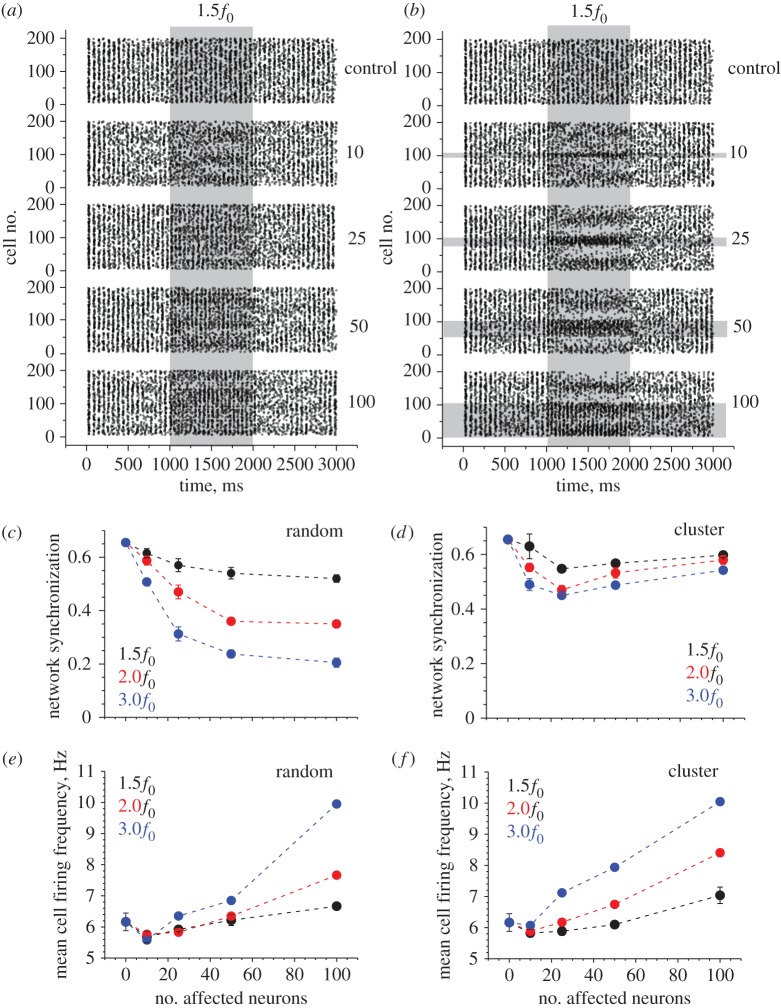
Figure 3.
Facilitation of excitatory input in a proportion of basket cells alters network synchronization while increasing cell firing rates depending on the spatial clustering of affected cells. (a) An example raster plot of cell firing (200 BCs) including the period of an inhibitory action. Numbers on the right (control, 10, 25, 50, 100) indicate the number of randomly selected BCs affected by the inhibitory action on their excitatory inputs. Shaded area labelled with 1.5f0 depicts an increased frequency f0 = 300 Hz by 50% (thus giving excitatory input at 450 Hz) over the designated 1000 ms period, as indicated. (b) A similar experimental design as in (a), but with the affected BCs grouped in spatial clusters of neighbours, as indicated by horizontal grey-shaded segments. Other notations as in (a). (c) The network synchronization parameter (§2d) measured throughout tests with a variable change in the excitatory input (1.5f0, 2.0f0 and 3.0f0 indicating silenced input) and variable numbers of affected BCs, as indicated. Data points show mean ± s.d. (d) Results of an experiment similar to that shown in (c), but with the affected BCs grouped in spatial clusters of neighbours, as depicted in (b); other notations as in (c). (e) The mean cell firing rate (§2d) measured throughout tests with a variable change in the excitatory input (1.5f0, 2.0f0 and 3.0f0 indicating silenced input) and variable numbers of affected BCs, as indicated. Data points show mean ± s.d. (f) Results of an experiment similar to that shown in (e), but with the affected BCs grouped in spatial clusters of neighbours, as depicted in (b); other notations as in (e).

