Figure 2.
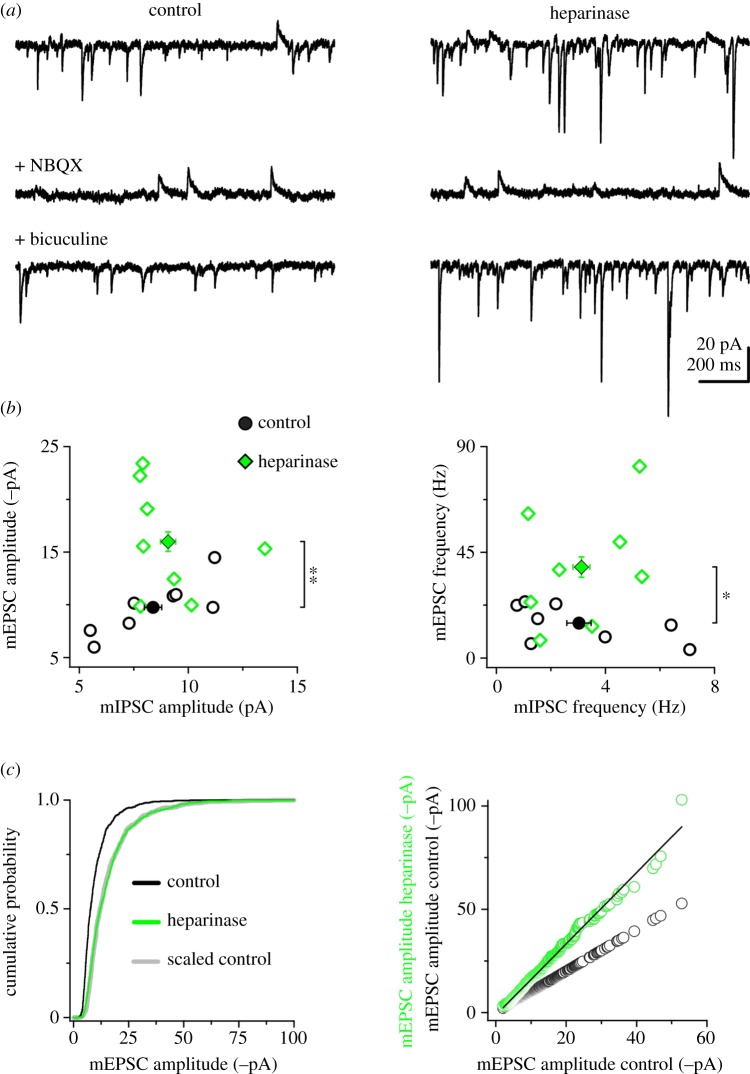
Chronic heparinase treatment increases mEPSC amplitude and frequency. (a) Simultaneous recordings of mEPSCs and mIPSCs from representative hippocampal neurons of control (left) and heparinase-treated cultures (right). Top, under basal conditions, mEPSCs and mIPSCs are detected as downward and upward going events, respectively. Middle, application of the AMPAR antagonist NBQX (1 µM) isolates mIPSCs. Bottom, wash-out of NBQX and application of the GABAA receptor antagonist bicuculline (10 µM) isolates mEPSCs (bottom). (b) Quantification of experiments as in (a) for mEPSC/mIPSC amplitude (left) and mEPSC/mIPSC frequency (right). Open symbols are averages for individual cells; filled symbols are average cell populations. Heparinase treatment increases mEPSC amplitude and frequency (**p = 0.01; *p = 0.03; unpaired two-tailed Student's t-test, n = 8 cells). (c) Left, cumulative distributions of mEPSC amplitude (first 100 events per cell) in control (black line) and heparinase-treated cultures (green line). The distribution of the scaled control data (grey line) overlapped with the distribution of heparinase-treated mEPSCs (p = 0.536 between heparinase and scaled control, p < 0.0009 between heparinase and control; Kolmogorov–Smirnov test), suggesting a global up-scaling of mEPSCs upon heparinase treatment. Right, mEPSCs (first 100 events per cell) were ranked according to their amplitudes and plotted against the ranked control distribution (open green circles: heparinase versus control; open black circles: control versus control). The black line represents the best linear fit (f(x) = b × x + a, with b = 1.7254 ± 0.00439 and a =−1.2444 ± 0.0511) used to scale the control cumulative distribution in the left panel. (Online version in colour.)

