
Figure 1.
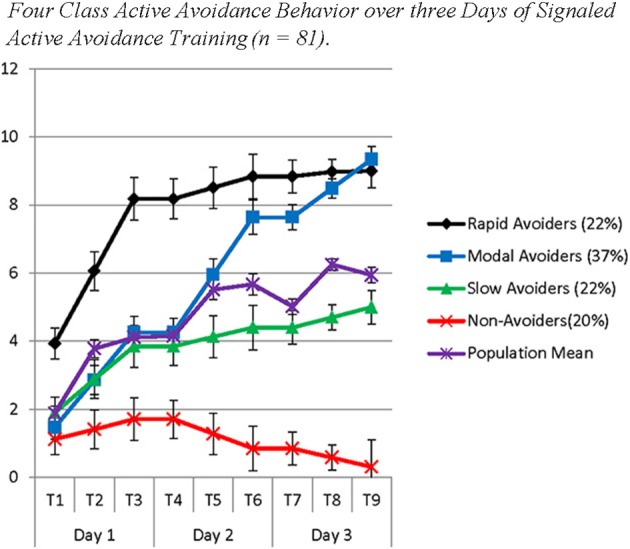
The figure represents four latent populations identified using Latent Class Growth Analysis across three days of Signaled Active Avoidance Training. Each time point represents the total number of successful avoidances out of 10 trials with estimates of the standard error around the mean. Each day of training is represented by three time-points. Distinct slopes for each class were identified for each day of training using a piecewise modeling approach. The purple line indicates the population mean.