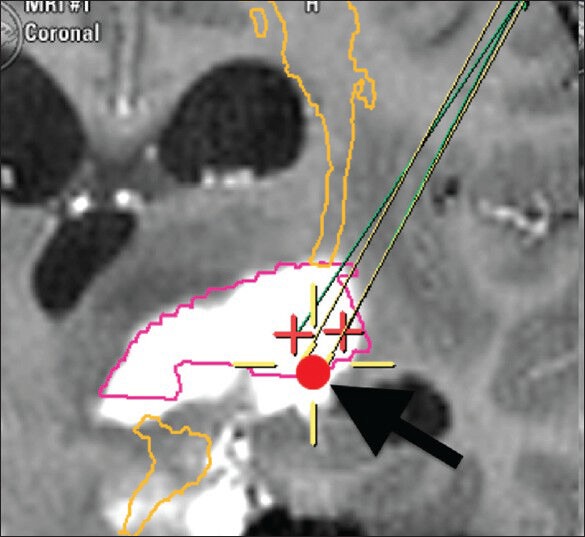
Figure 1.

Tractography and the target of the tumor for biopsy. This image was made by using iPlan on the basis of the T1-weighted image of the patient. The tumor was enhanced by gadolinium diethylenetriamine pentaacetic acid. The ocher lines show presumed pyramidal tract. Arrow indicates the target of the tumor for biopsy
