. 2011 Jul-Dec;5(2):182–186. doi: 10.4103/0259-1162.94761
Copyright: © Anesthesia: Essays and Researches
This is an open-access article distributed under the terms of the Creative Commons Attribution-Noncommercial-Share Alike 3.0 Unported, which permits unrestricted use, distribution, and reproduction in any medium, provided the original work is properly cited.
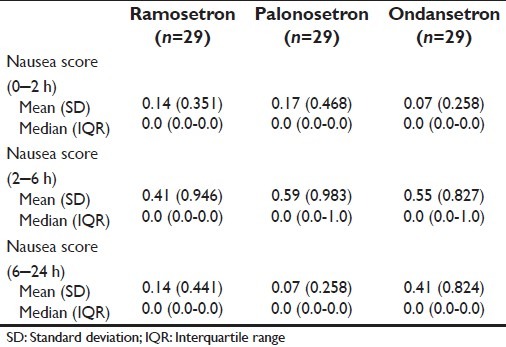
Table 3.
Change in nausea score over time in the three study groups