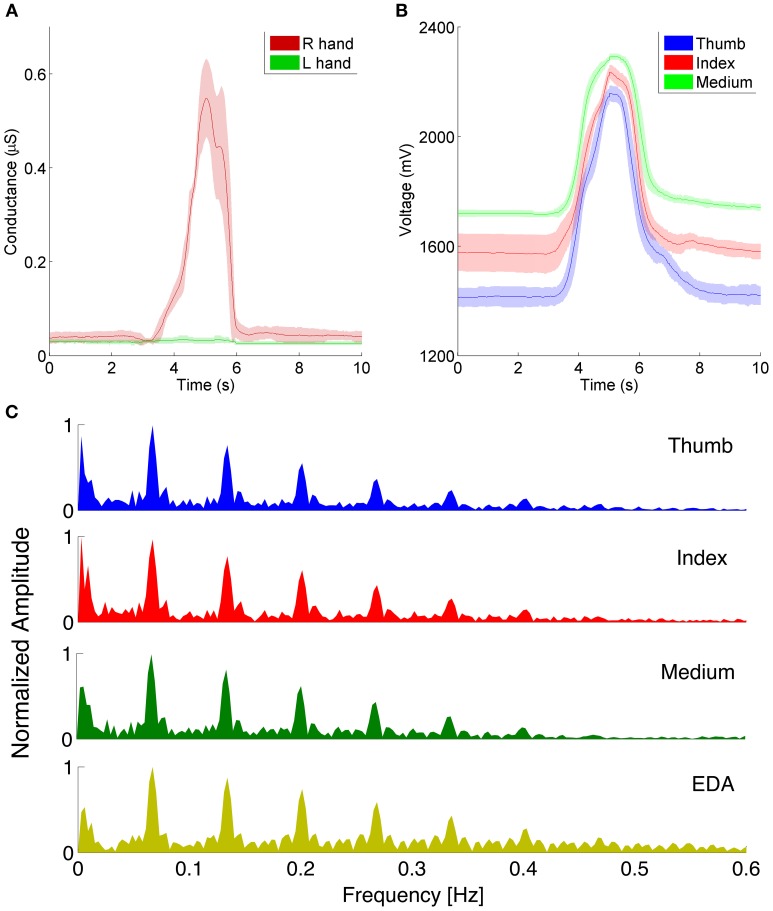
Figure 3.
(A) Averaged EDR signals of a subject while performing a grabbing gesture with the right hand (red trace) whereas the left hand is in rest conditions (green trace). (B) Right hand fingers flexion signals acquired in correspondence of the EDR recordings of (A). The peaks of the flexion occur at the same time of the peaks observed in the EDR. Each trace in (A,B) is the average of three sweeps ± standard deviation. (C) Comparison of EDR and finger flexion spectral contents. The Y axis shows the normalized amplitude of the Fourier transform.

