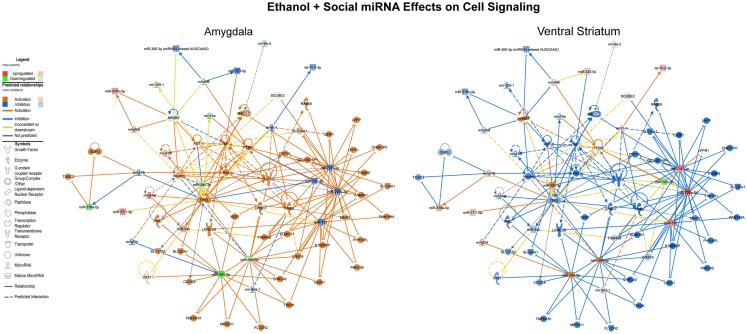
Figure 3.
Ethanol and social enrichment effects on microRNAs. The results of a gene network level analysis of all of the miRNAs with changes in one or more of the contrasts listed in Tables 1 and 2 are shown. Genes and miRNAs with increased or predicted increased expression are shown in red and orange, respectively, while genes and miRNAs with decreased or predicted decreased expression are shown in green and blue, respectively. Genes and miRNAs with conflicting predicted vs observed data are connected by yellow lines, and genes and miRNAs with absent data or unpredicted relationships are unfilled and connected by gray lines. Note that in general, the network is activated in the amygdala and inhibited in the ventral striatum.

