
Figure 2.
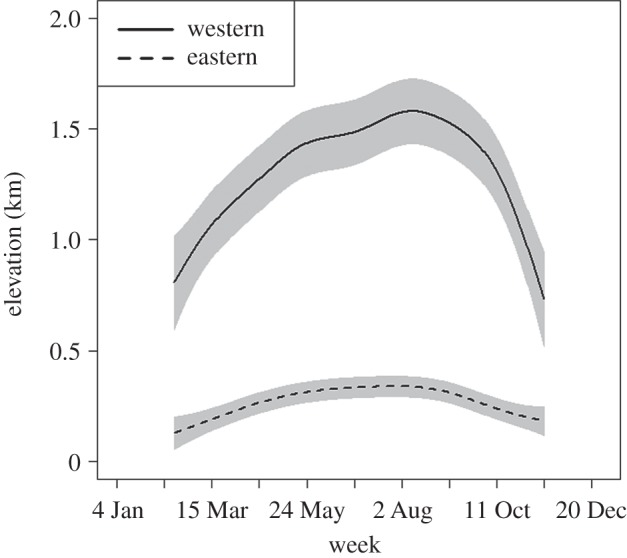
Weekly associations with elevation for species in the western (n = 26) and eastern flyways (n = 31) fitted with GAMMs with species as a random effect. Each fit includes 95% confidence bands.
Official websites use .gov
A
.gov website belongs to an official
government organization in the United States.
Secure .gov websites use HTTPS
A lock (
) or https:// means you've safely
connected to the .gov website. Share sensitive
information only on official, secure websites.
Weekly associations with elevation for species in the western (n = 26) and eastern flyways (n = 31) fitted with GAMMs with species as a random effect. Each fit includes 95% confidence bands.