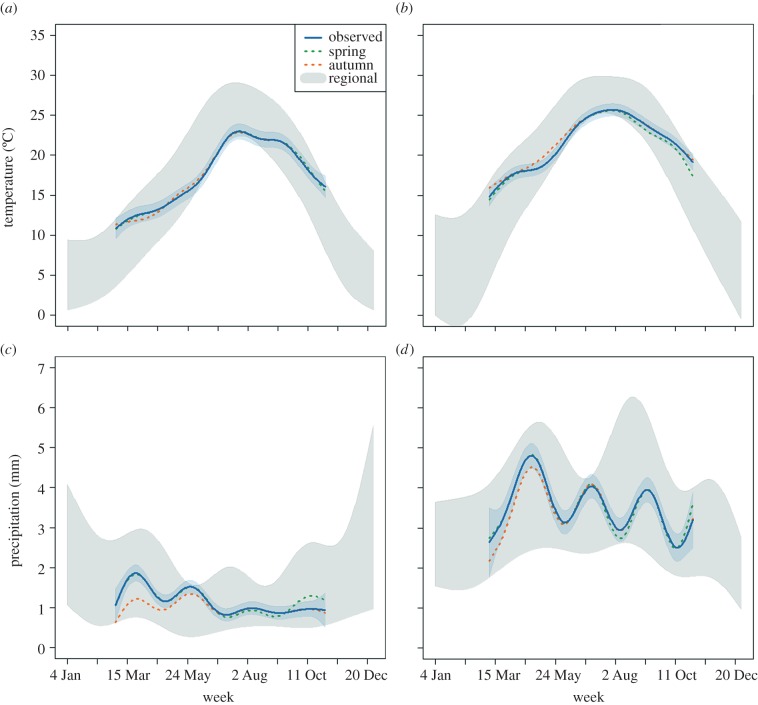
Figure 3.
Observed associations and associations under three alternative migration scenarios (figure 1) with (a,b) temperature and (c,d) precipitation for species in the western (n = 26) and eastern (n = 31) flyways. The solid line with a 95% confidence band is the observed association fit using a GAMM with species as a random effect. The regional migration scenario estimates the range of possible associations available to each species, the spring migration scenario estimates associations had species used their spring migration route in the autumn and the autumn migration scenario estimates associations had species used their autumn migration route in the spring (see Material and methods for details on scenarios).

