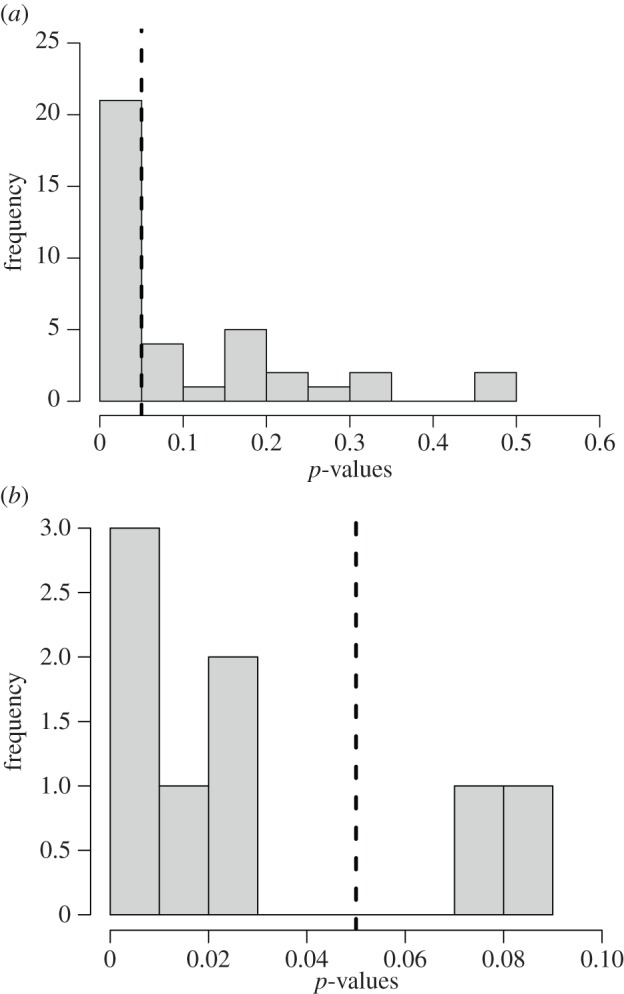
Figure 2.

Histograms of p-values showing the number of videos where it was significantly probable that (a) the vultures were following the raptors and (b) the raptors were following the vultures. The vertical lines show the level of significance at p = 0.05.
