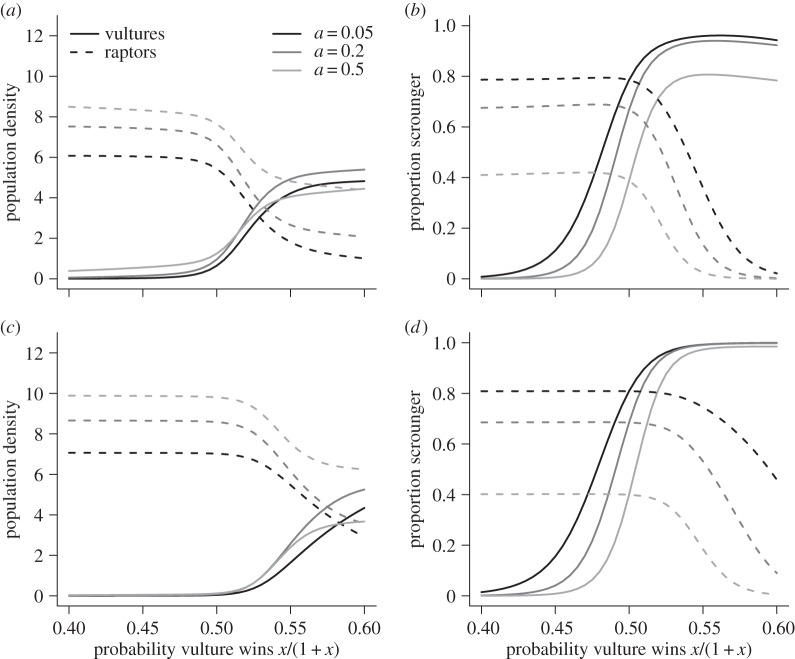
Figure 3.
Game theory results. (a,c) Population densities for each species (vultures, solid lines; raptors, dashed lines), and (b,d) frequencies of scroungers in both the vulture and raptor populations. (a,b) Raptors rely strongly on carcasses (γ = 0.05); (c,d) they rely more weakly on carcasses (γ = 0.15). Line shades indicate different values for the finder's fee (black, a = 0.05; dark grey, a = 0.2; light grey, a = 0.5). The x-axis is the probability that a vulture wins a one-on-one interaction, x/(1 + x). Mortality rates are α = 0.1 and β = 0.1 for all panels.

