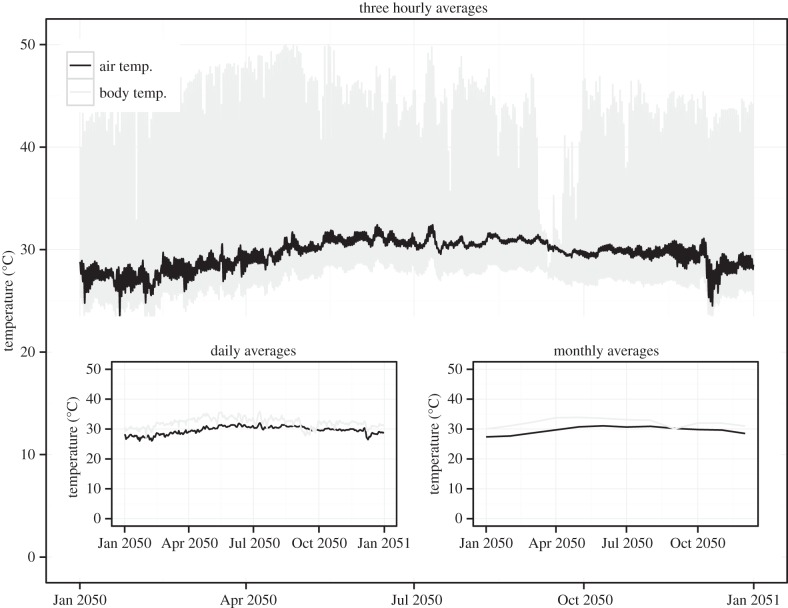
Figure 2.
Air temperature variation (black) and C. lacinia avoidance body temperature variation (grey) based on solar radiation and air temperature projections (GFDL A2) at three-hourly intervals for the year 2050 (see electronic supplementary material S5 for details). Air and body temperature averaged over days (left inset) and months (right inset) also displayed.

