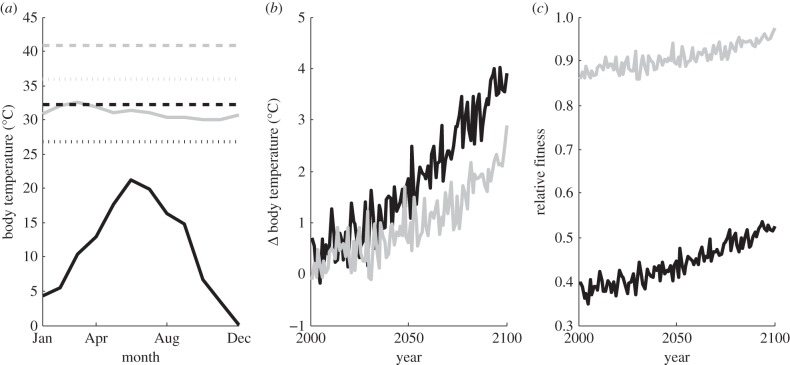
Figure 3.
(a) Variation in monthly mean C. lacinia body temperature estimates based on observed surface air temperature (CRU) and solar radiation (ISCCP) for Arizona (black) and El Salvador (grey) with theoretically derived critical thermal maximum values or the end of the thermal performance curve where fitness declines to zero (dashed horizontal lines) and thermal optimum estimates (dotted horizontal lines). (b) Projected changes in C. lacinia body temperature based on projected changes in air temperature and solar radiation (GFDL). (c) Projected change in relative fitness given the estimated thermal performance curve and body temperature change.

