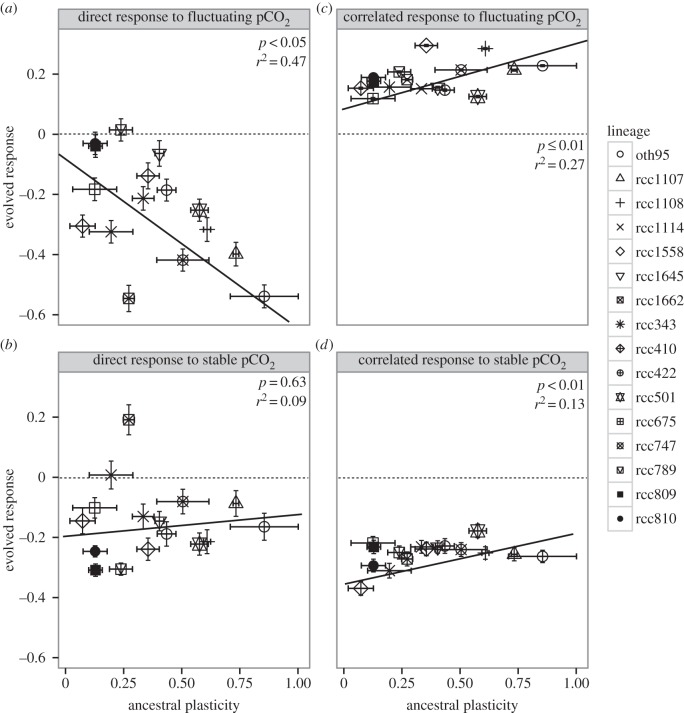
Figure 1.
(a–d) Lineages with higher ancestral plasticity evolve more. Direct and correlated responses to selection plotted as a function of plasticity in oxygen evolution rates before evolution (ancestral plasticity). For all panels (a–d), different shapes represent mean values for each lineages ± 1 s.e. For each lineage n = 3. Dashed line indicates no response to selection. Panel (a) (selection in FH, assay at 1000 ppm CO2): ancestral plasticity in FH evolved lineages predicts up to 47% of the evolutionary response (F2,13 = 210.67, p < 0.001). FH populations evolve slow growth in response to high pCO2. Panel (b) (selection in SH, assay at 1000 ppm CO2): with no selection for plasticity, a linear relationship using ancestral plasticity as the only explaining variable is not statistically significant (p = 0.63). Still, most lineages evolve lower growth rates (range from −0.31 to −0.08, mean −0.15 ± 0.12). Panel (c) (selection in FH, assay at 430 ppm CO2): ancestral plasticity is a significant nonlinear predictor of the correlated response to selection (F2,13 = 563.38, p < 0.0001). Lineages from FH increased their growth rate at ambient pCO2 the most when their ancestral plasticity was high (increase in growth of 0.12–0.30, mean 0.19 ± 0.05). Panel (d) (selection in SH, assay at 430 ppm CO2): lineages selected in SH had a negative correlated response, and the relationship between ancestral plasticity and the correlated response to selection was significant (F2,13 = 22.28, p < 0.01), though best described by a nonlinear fit (p-values and r2 reported on the panels are for linear regression).

