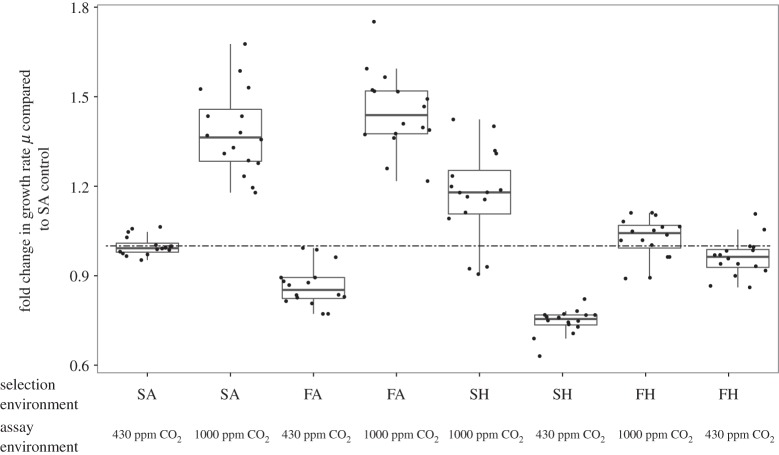
Figure 3.
Evolution at elevated pCO2 reverses short-term growth responses to changes in pCO2. Selection regime changes how lineages respond to CO2 enrichment following 400 generations of selection (F7,105 = 123.38, p < 0.001). Here, n = 48 for each selection and each assay environment. The dashed line indicates no change compared with SA populations. Populations selected in SA show the expected plastic response in growth to CO2 enrichment after 400 generations of selection, where mean growth rate at elevated pCO2 is higher than at 430 ppm CO2 (F7,105 = 114.88, p < 0.001, mean growth rate of SA populations assayed at 430 ppm: 0.67 ± 0.02 d−1, mean growth rate of SA population assayed at 1000 ppm CO2: 0.79 ± 0.03 d−1). When grown at elevated pCO2, the growth rate of lineages selected at FH or SH is lower than the short-term response of their respective controls (i.e. FA or SA) growing at high pCO2 (post-hoc FH p < 0.05 and SH p < 0.05). Populations selected at SH also have negative correlated responses to selection. Growth rate of SH lineages at 430 ppm CO2: 0.5 ± 0.01 d−1, after growth rates have recovered, while lineages selected in FH have an average growth rate of 0.69 ± 0.02 d−1.

