Figure 3.

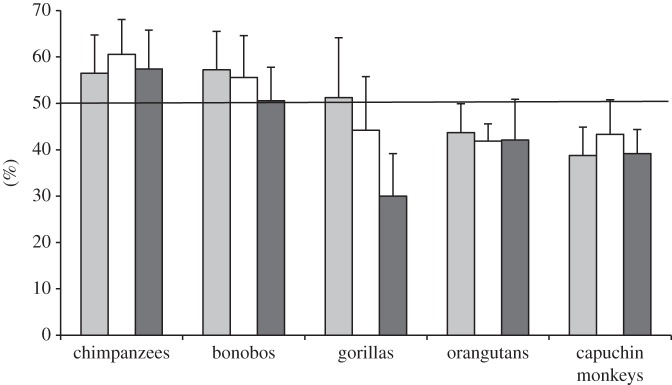
Mean percentage of prosocial choices (+s.e.) in the Experimental (grey bars), Control (white bars) and Solitary (black bars) conditions of the Tokens task, as a function of species. The black line represents chance performance (at 50%).

Mean percentage of prosocial choices (+s.e.) in the Experimental (grey bars), Control (white bars) and Solitary (black bars) conditions of the Tokens task, as a function of species. The black line represents chance performance (at 50%).