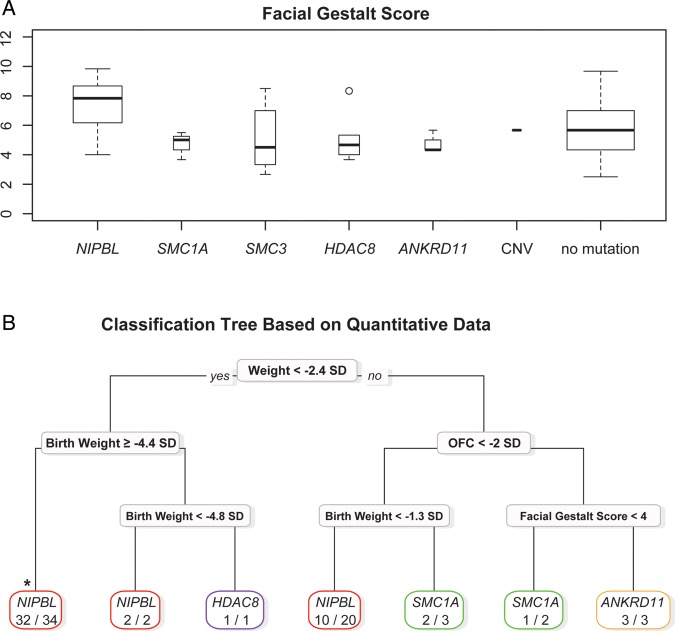
Figure 4.
(A) Box plot of the facial gestalt scores for each gene category, genomic rearrangements (copy number variants, CNV) and mutation-negative cases. (B) Classification tree based on prenatal and postnatal growth data, severity and facial gestalt scores and genetic data. *Marks the most NIPBL-positive cases classified in a single branch. OFC, occipital frontal circumference.

