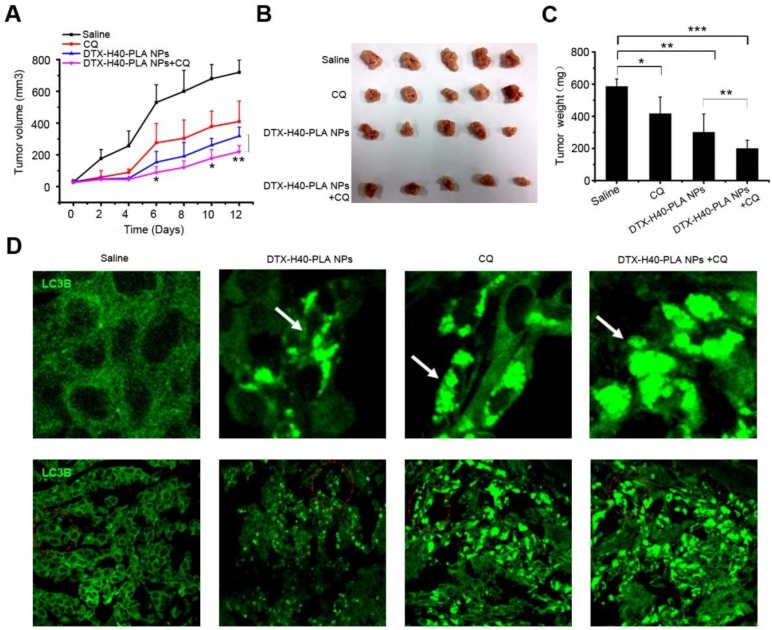
Figure 8.
Inhibition of autophagy that induced by DTX-H40-PLA NPs by CQ enhances cancer cell killing in vivo. (A) Tumor growth curve of the SCID mice bearing MCF-7 cells xenograft after intratumoral injected with saline, DTX-H40-PLA NPs, CQ, and DTX-H40-PLA NPs in combination with CQ. Data are shown as the mean ± S.E.M. *P<0.05, ** P<0.01 compared to DTX- H40-PLA NPs group. (B) Morphology of the tumors of each group taken out from the sacrificed mice at the study end point. (C) Tumor weight of each group at the study end point. Data are shown as the mean ± S.E.M. *P<0.05, ** P<0.01, *** P<0.001 compared to controls or DTX-H40-PLA NPs group as indicated. (D) LC3 distribution in the tumor tissues of each group. Autophagosomes are indicated by the arrows. The above images are the enlarged ones in the red collar on the underside images. Scale bars: 10 μm.

