Figure 2.
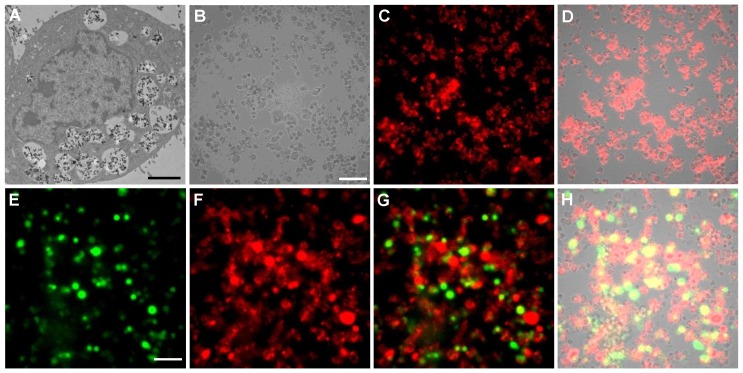
TEM and luminescence microscopic studies of PEI-LGO:Cr nanoparticles-labeled 4T1 cells. (A) Thin-section TEM image of a 4T1 cell labeled with PEI-LGO:Cr nanoparticles. The nanoparticles were accumulated in cell endosomes/lysosomes. Scale bar, 2 μm. (B) Bright-field image of PEI-LGO:Cr labeled 4T1 cells (fixed). Scale bar, 100 μm. (C) NIR persistent luminescence image of the cells in (B) after irradiation by a 254 nm UV lamp for 5 min. The image was acquired 20 s after the irradiation. (D) Merged image of (B) and (C). (E) Bioluminescence image of PEI-LGO:Cr-labeled f-luc-4T1 cells. The cells were incubated with D-luciferin (150 µg/mL) 10 min before the imaging. The image was taken by setting the emission filter as “open”. The signals were from f-luc. Scale bar, 100 μm. (F) NIR persistent luminescence image of the cells in (E) after irradiation by a 254 nm UV lamp for 5 min. A Cy5.5 emission filter was used. (G) Merged image of (E) and (F). (H) Merged image of (G) and the corresponding bright-field image (not shown individually here). The images in (B), (C), (E), and (F) were taken on an Olympus LV200 bioluminescence microscope. The exposure time in (C), (E) and (F) is 1 min.

