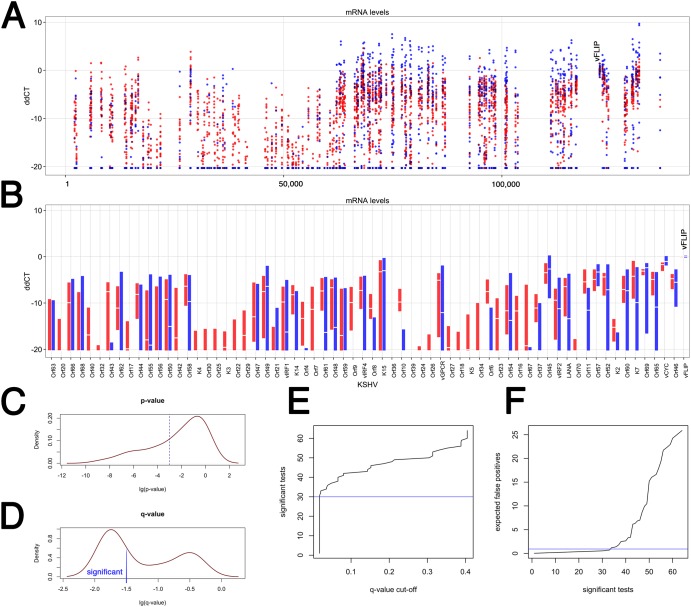
FIG 4 .
Analysis of individual KSHV transcripts across two KS subtypes in the validation set (n = 35). (A) Dot plot of the ddCT values on the vertical axis versus KSHV genome position on the horizontal axis. The ddCT values were obtained by first normalizing to the geometric mean of a set of “housekeeping mRNAs” and then the level of vFLIP mRNA (indicated at ddCT = 0). Red indicates samples from the “expanded” subtype, and blue indicates samples from the “restricted” KS subtype. All samples with a ddCT value of <−20 were set to ddCT = −20 and considered background. (B) Box plot of the ddCT values on the vertical axis versus KSHV Orf on the horizontal axis. All primers within the same Orf were averaged to give the “white” median value. The extent of the box indicates the 25th to 75th percentiles of the data. Outliers are not shown. Red indicates samples from the “expanded” subtype, and blue indicates samples from the “restricted” KS subtype. The vFLIP measurements used for normalization are shown on the far right. (C) P value distribution of Wilcoxon nonparametric comparison of relative mRNA levels by Orf between “red” and “blue” KS subtypes. (D) q value distribution, which represents adjustment for multiple comparison. A significance level of log(q) < 1.5, i.e., q < 0.03, is shown. (E) Distribution of the expected number of significant tests at a given q value cutoff. (F) Distribution of the expected number of false-positive comparisons based on the number of significant tests. Table S2 lists these mRNAs.

