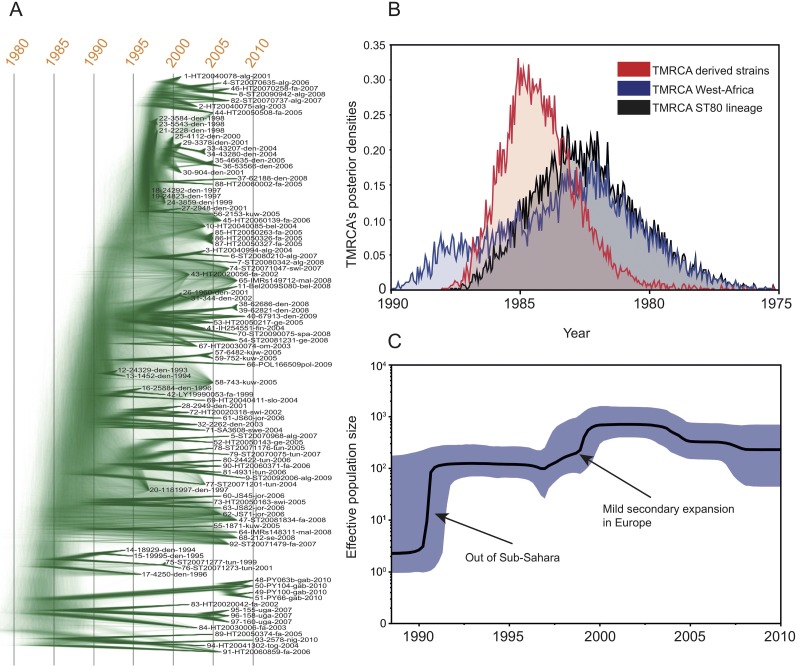
FIG 2 .
Bayesian analyses of the CC80 complex. (A) DensiTree representation of the Bayesian coalescent trees using a strict clock model based on 3,493 SNPs. Tips of the trees are constrained by year of isolation; the time scale is shown at the top. (B) Posterior estimates of the TMRCA for the derived and sub-Saharan African strains under the strict clock model. (C) Effective population size through time (Bayesian skyline) of the S. aureus CC80 lineage. The shaded area represents the 95% confidence intervals, and the arrows point to potential socioeconomic events that might have impacted the demography of the MRSA population.

