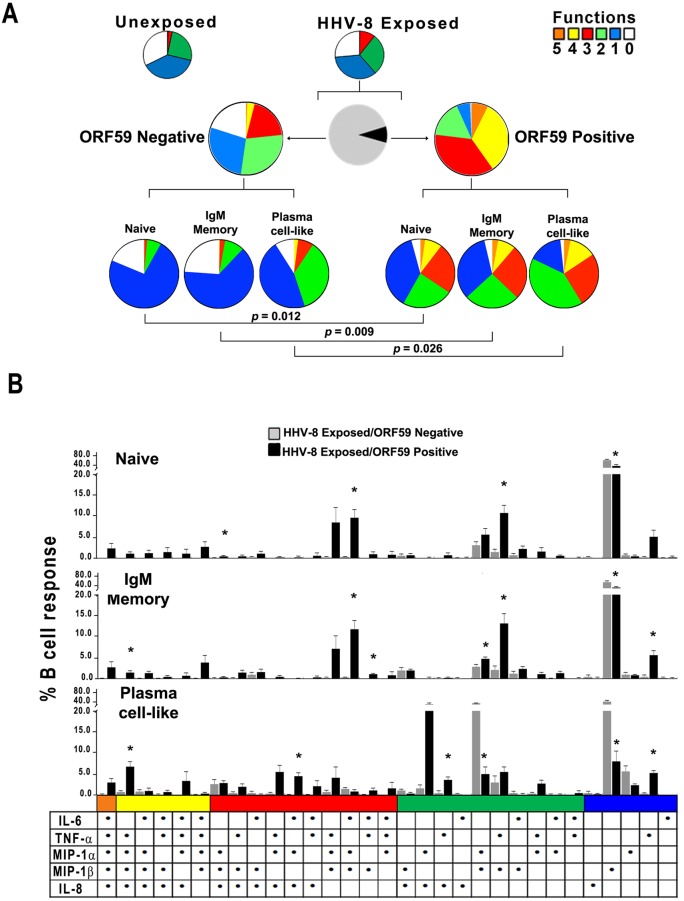
FIG 2 .
HHV-8 targets naive and IgM memory B cells and plasma cell-like subsets for lytic infection and induction of polyfunctional responses in vitro. (A, top row) Cytokine and chemokine responses were assessed at 48 h in unexposed and HHV-8-exposed B cells that were derived from HHV-8-naive, CD19+ B cells activated with CD40L and IL-4 by intracellular staining of ORF59 PF-8 and 5 cytokines and chemokines by polychromatic flow cytometry. The colored pie charts show the relative production of 0 to 5 cytokines and chemokines in HHV-8-unexposed (left) and -exposed (right) B cell cultures. (Middle row) Further gating was done on the virus-exposed B cell cultures to distinguish infected from uninfected cells. The black and gray pie chart indicates the proportion of infected ORF59 PF-8pos (black) and uninfected ORF59 PF-8neg (gray) B cells. The colored pie charts display the proportion of uninfected (left) and infected (right) B cells within the virus-exposed cultures that expressed 0 to 5 cytokines and chemokines. (Bottom row) Production of cytokines and chemokines in B cell lineage phenotypes: naive (CD19+ CD20+ IgM+ IgD+ CD27¯ CD138¯), IgM memory (CD19+ CD20+ IgM+ IgD± CD27+ CD138¯), and plasma cell-like (CD138+ CD20± CD38±) subsets within the ORF59 PF-8neg (left charts) and ORF59 PF-8pos (right charts). (B) HHV-8-exposed B cells were stained for phenotypic markers, ORF59 PF-8, and intracellular cytokines at 48 h. Cytokine and chemokine production was determined for naive, IgM memory, and plasma cell-like populations among ORF59 PF-8neg and ORF59 PF-8pos cells. Values are means ± SE; n = 4. SPICE was used to derive P values. Fig. 2B: *, P < 0.05 comparing HHV-8 exposed ORF59 negative to HHV-8 exposed ORF59 positive.

