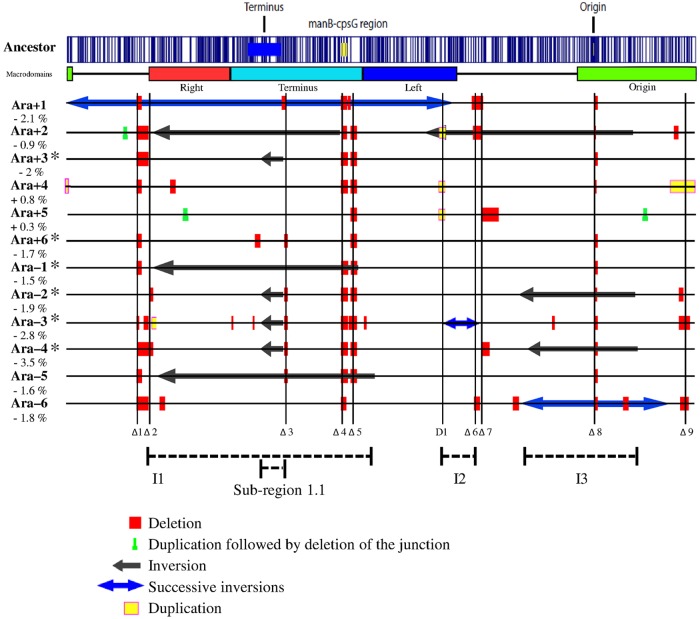
FIG 1 .
Large-scale chromosomal rearrangements in evolved clones sampled after 40,000 generations from each of the 12 populations of the long-term evolution experiment. Each clone is indicated by the name of the population from which it was sampled. Asterisks mark clones that evolved point mutation rates higher than those seen with the ancestor. The percentage value shown below each clone designation indicates the change in its genome size relative to the ancestor. The optical map of the ancestral strain, computed from its genome sequence (70), is shown on the top, with the vertical blue lines showing the locations of the NcoI restriction sites used for this procedure. The locations of the replication origin and terminus are shown on the ancestral map, together with the manB-cpsG region that was affected by deletions in 10 evolved clones. The chromosomal macrodomains (26) are indicated below the ancestral map. All large rearrangements are shown, relative to the ancestral genome for easier comparison, using the color key below the figure. New IS element insertions cannot be detected by optical mapping because they generally produce rearrangements too small to be resolved by this method. Vertical lines labeled Δ1 to Δ9 indicate regions affected repeatedly (in two or more populations) by deletions; the D1 vertical line indicates a region affected repeatedly by duplication events. Three chromosomal intervals, shown as I1 to I3, and a subregion (1.1) within I1 were affected repeatedly by inversions. We describe the boundaries of all chromosomal rearrangements according to the ancestral map shown here. As a consequence, three inversions (inversion 1 in Ara+1 and inversions 1 and 2 in Ara–3) have sizes larger than one-half of the chromosome (see Table S1 in the supplemental material). These inversions could have been described alternatively as inversions of the other part of the chromosome, with their sizes then being smaller than one-half of the chromosome. For example, we describe inversion 1 as being ~2.8 Mbp, whereas its size would be ~1.8 Mbp according to the alternative description. We use the coordinates according to the ancestral map for internal consistency, and this choice does not affect any conclusions.

