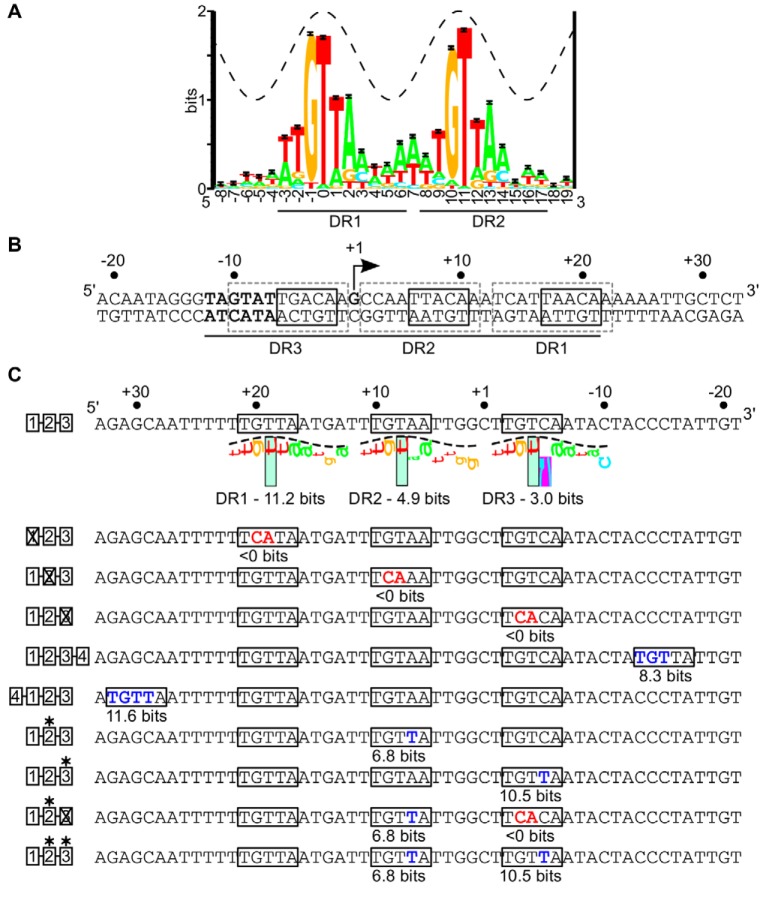
FIG 1 .
(A) Sequence logo for the minimal ArcA binding site consisting of two 10-bp direct repeat elements (5′-ATGTTAAAAA-1-ATGTTAAAAA-3′) (4). The total sequence conservation is 15.6 ± 0.07 bits in the range from positions −3 to +14. The crest of the sine wave represents the major groove of B-form DNA. (B) Regulatory region of the icdA P1 promoter from E. coli. The arrow indicates the position of the previously mapped transcription start site (5), with the σ70-RNAP −10 promoter element in bold. Each of three 10-bp DR elements is indicated by dashed-line gray boxes, with the most conserved 5-bp 5′-TGTTA-3′ region within each DR element indicated with a solid-line black box. The ArcA-P footprint region is indicated underneath the sequence by the black line (4). (C) Noncoding strand of the icdA-lacZ promoter, depicting the ArcA binding site mutations used in this study. The degree of match of each DR element to the 10-bp ArcA DR element PWM (4) is indicated in bits and visualized using sequence walkers (40). The purple box surrounding the C at position 6 indicates a contact that is more unfavorable than −4 bits and, thus, off the scale. The boxes to the left of the binding sites are the key used to indicate mutations in subsequent figures. Mutations away from the consensus in each DR element (5′-TGTTA-3′ to 5′-TCATA-3′) are indicated in red and labeled with a × in the cartoon, while mutations toward the consensus are indicated in blue and are labeled with an asterisk. The information content for all 10 bp of each mutated DR element is listed below the DR element.

