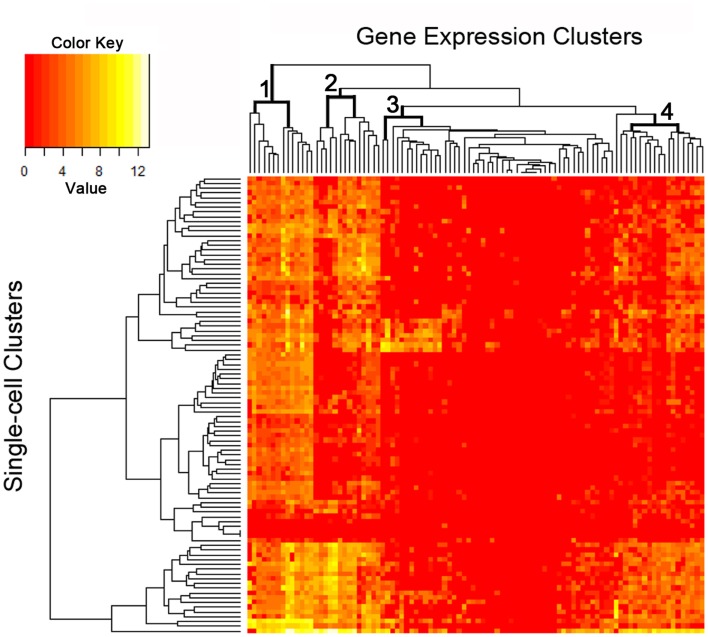
Figure 6.
The single-cell analysis data from the custom PCR panel processed using an unsupervised hierarchical clustering algorithm. Phenotypic “markers” were incorporated into the gene expression panel to facilitate cell subset identification as well as correlation with histologic and flow cytometric studies. Four groups of markers are significantly expressed at single-cell level as shown in the figure (see top dendrogram).

