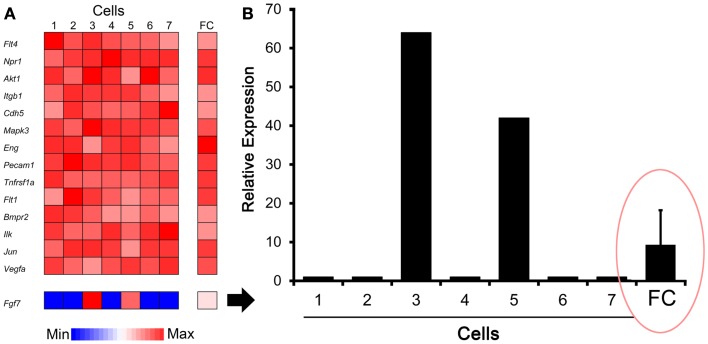
Figure 8.
Comparison of gene expression using single-cell analysis and flow cytometry (FC) cell isolation. (A) Defined by endothelial cell marker genes (e.g., Pecam1), cells #1–7 expressed genes typically associated with endothelial cells. Some genes, such as Fgf7 shown here, were expressed by only a subset of cells in the single-cell analysis. (B) Single-cell expression of the Fgf7 gene was compared with seven single cells and FC sorted cell populations. The endothelial cells from normal lungs were isolated by FC cell sorting (10,000 cells based on CD31+ surface expression) as previously described (10). The results demonstrated population-averaged level of Fgf7 expression that was not representative of any individual cell (ellipse). The gene expression was normalized to an arbitrary 100-point scale for comparison; error bar reflects 1 SD of triplicate samples.

