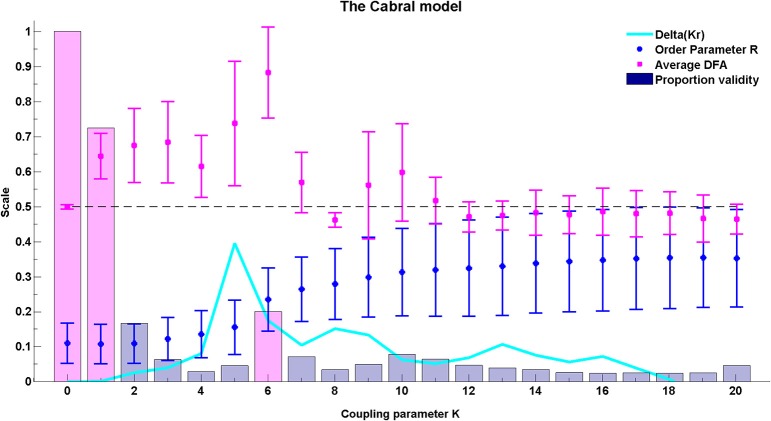
Figure 10.
The average DFA exponents of phase synchrony as a function of the coupling parameter, K, in the extended Kuramoto model (Cabral et al., 2011). The model includes 66 oscillators at normally distributed natural frequencies with mean 60 Hz and standard deviation σi = 1.25. The connectivity and time delay matrices are set from empirical values. The average of the valid DFA exponents is shown in magenta and the proportion of valid exponents, as calculated by ML-DFA, are indicated by bars. The Kuramoto model order parameter r is in blue, and the quantity Δ(Kr) is in cyan. The peak Δ(Kr) has been used as an indicator of the effective critical coupling. A horizontal line at DFA exponent 0.5 is plotted to guide the eye. The proportion of valid DFA bars for K = 0, K = 1, and K = 6 have been shaded in magenta.

