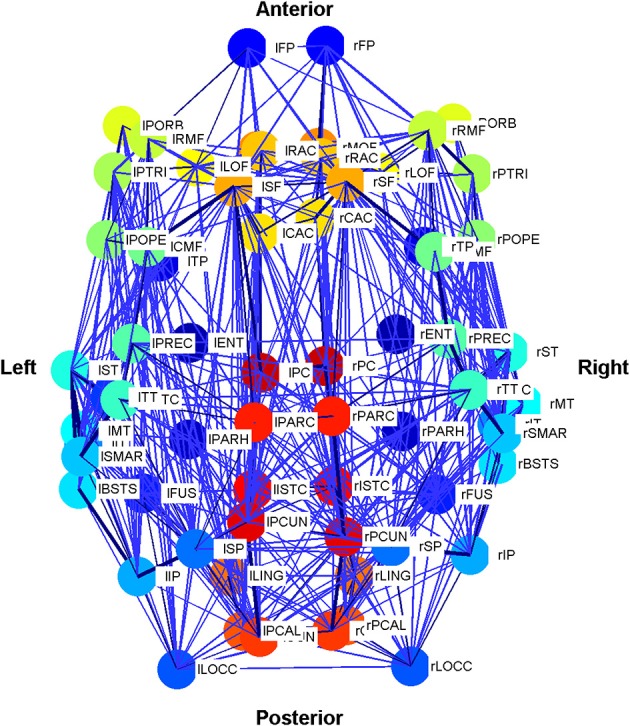
Figure 3.

Schematic plot (top view) of the Cabral human brain model showing the connections and connection weights between oscillators which correspond to different brain regions. The weight of the connection lines represent the strength of connectivity between the oscillators. The darkest blue lines are the strongest 1% of connections. The node colors represent oscillators, which model different brain regions as detailed in Cabral et al. (2011). Colors are consistent for homologous regions in the left and right hemispheres. Anterior and posterior, left and right are shown.
