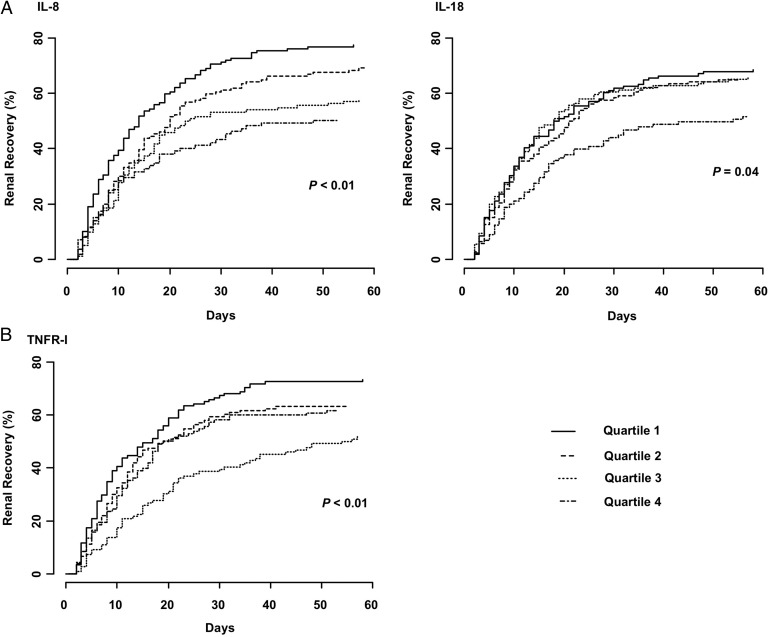
FIGURE 2:
Kaplan–Meier failure plots showing time to renal recovery stratified by quartiles of plasma inflammatory (A) and apoptosis (B) biomarker concentrations. Markers were compared across quartiles for trend using a log-rank test for ordered survival curves. Higher plasma IL-8, IL-18 and TNFR-I concentrations are associated with slower renal recovery.

