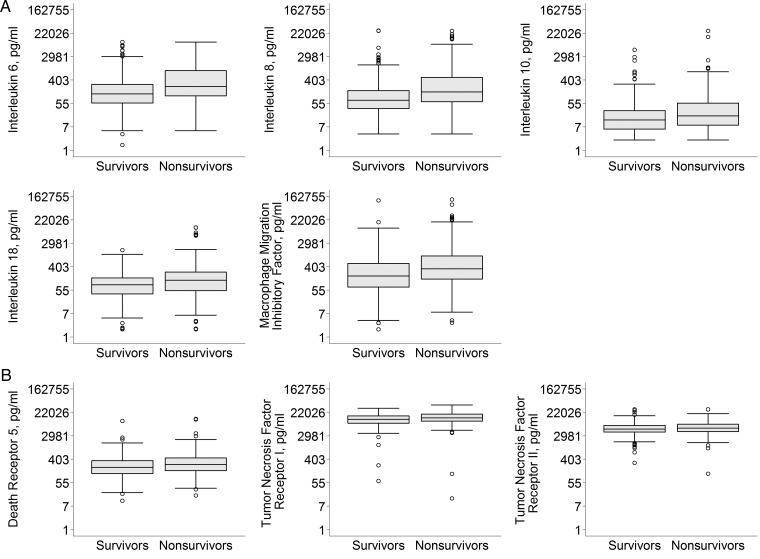
FIGURE 3:
Plasma inflammatory and apoptosis biomarker concentrations stratified by 60-day mortality. Boxplot summaries of plasma inflammatory (A) and apoptosis (B), biomarker concentrations are displayed in natural logarithm scale and labeled with their corresponding biomarker concentration in picograms/milliliter. The vertical box represents the 25th percentile (bottom line), median (middle line) and 75th percentile (top line) values. The lowest datum (lower whisker) represents 1.5 times the interquartile range of the lower quartile and the highest datum (upper whisker) represents 1.5 times the interquartile range of the upper quartile. The open circles represent the outliers. *P < 0.05.

