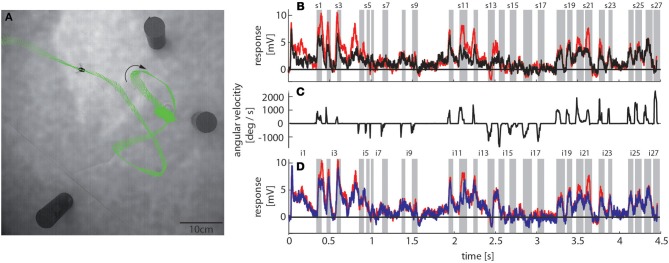
Figure 3.

Bumblebee flight trajectory and corresponding neuronal response traces of a single neuron with preferred direction of motion from back-to-front. (A) Trajectory of a typical learning flight during the navigational task involving landmarks. Each green line indicates a point in space and the corresponding viewing direction of the bee's head each 4ms. The arrow indicates the direction of flight. (B) Mean response traces of a single neuron recorded during presentation of two different stimulus conditions. Baseline membrane potential is subtracted. Red trace: homogeneous landmark condition ([condition 2]; 9 repetitions), black trace: no landmark condition ([condition 1]; 7 repetitions). Responses are subdivided into intersaccades and saccades (gray shadings). (C) Changes of head orientation. Positive/negative values denote turns to the left and right, respectively. (D) Response traces of the same neuron as in (B). Red trace: as described above. Blue trace: random pattern landmark condition, i.e., camouflaged landmarks ([condition 3]; 7 repetitions).
