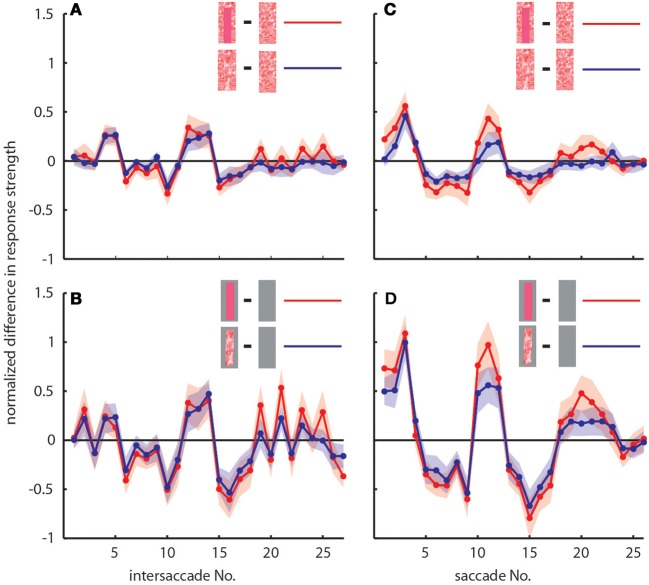
Figure 4.
Response profiles of mean, normalized differences between pairs of stimulus conditions for consecutive intersaccades (A,B) and saccades (C,D) during the learning flight of LWCs with a preferred direction from back-to-front. (A,C) Mean normalized difference of responses to one stimulus condition with object and one without (“object-induced response changes”). Red traces: object-induced response change for “homogeneous landmark” [2] and “no landmark” condition [1]. Blue traces: object-induced response change for “random pattern landmark” condition [3] and “no landmark” condition [1]. For (A) and (C) the number of included cells is n = 11. (B,D) Traces have the same meaning as in (A) and (C), but object-induced response changes were induced by stimulus conditions with the random background being replaced by a uniform gray background. For (B,D), n = 7. Shadings indicate SEM. For details on normalization procedure see Materials and Methods.

