
Figure 8.
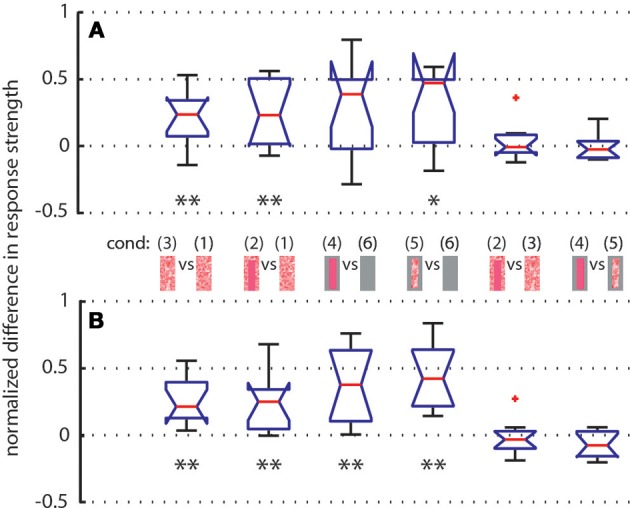
Normalized differences between responses of LWCs to pairs of stimulus conditions (see pictograms between A and B) during intersaccade No. 13 (subplot A) and No. 14 (subplot B) Depicted data from LWCs with preferred direction of motion from back-to-front. Number of cells: N = 11. Explanation of box symbols: red central horizontal line—median; box edges represent 25th and 75th percentiles; whiskers—most extreme data points that are not outliers (>75th percentile +1.5* box size OR <25th percentile –1.5 * box size). Outliers are plotted separately (red dots). Notches describe the 95% confidence intervals of the median. Two medians are significantly different at the 5% significance level if the notches do not overlap (McGill et al., 1978). Asterisks indicate statistically significant deviation from zero (two-tailed t-test; *p < 0.05, **p < 0.01). Median at zero level means no object influence.